In ComplexHeatmap, labels and other related settings in anno_block()
always correspond to the heatmap slices from top to bottom after the heatmap
is generated, which means, you always need to first generate the heatmap,
then to observe how the heatmap slices are ordered and finally to set a proper value for
labels. It is difficult to map the labels in anno_block() to the heatmap
slices if clustering is applied, or when the ordering is unknown before the heatmap
is drawn.
Let’s see the following example. In the first example, the split variable has the order
of "A", "B", "C", so when the row clustering is not applied, it is safe to also set
labels = c("A", "B", "C") in anno_block().
library(ComplexHeatmap)
set.seed(123)
m = matrix(rnorm(200), nrow = 20)
split = c(rep("A", 12), rep("B", 6), rep("C", 2))
Heatmap(m, row_split = split, cluster_rows = FALSE,
    right_annotation = rowAnnotation(foo = anno_block(labels = c("A", "B", "C"))))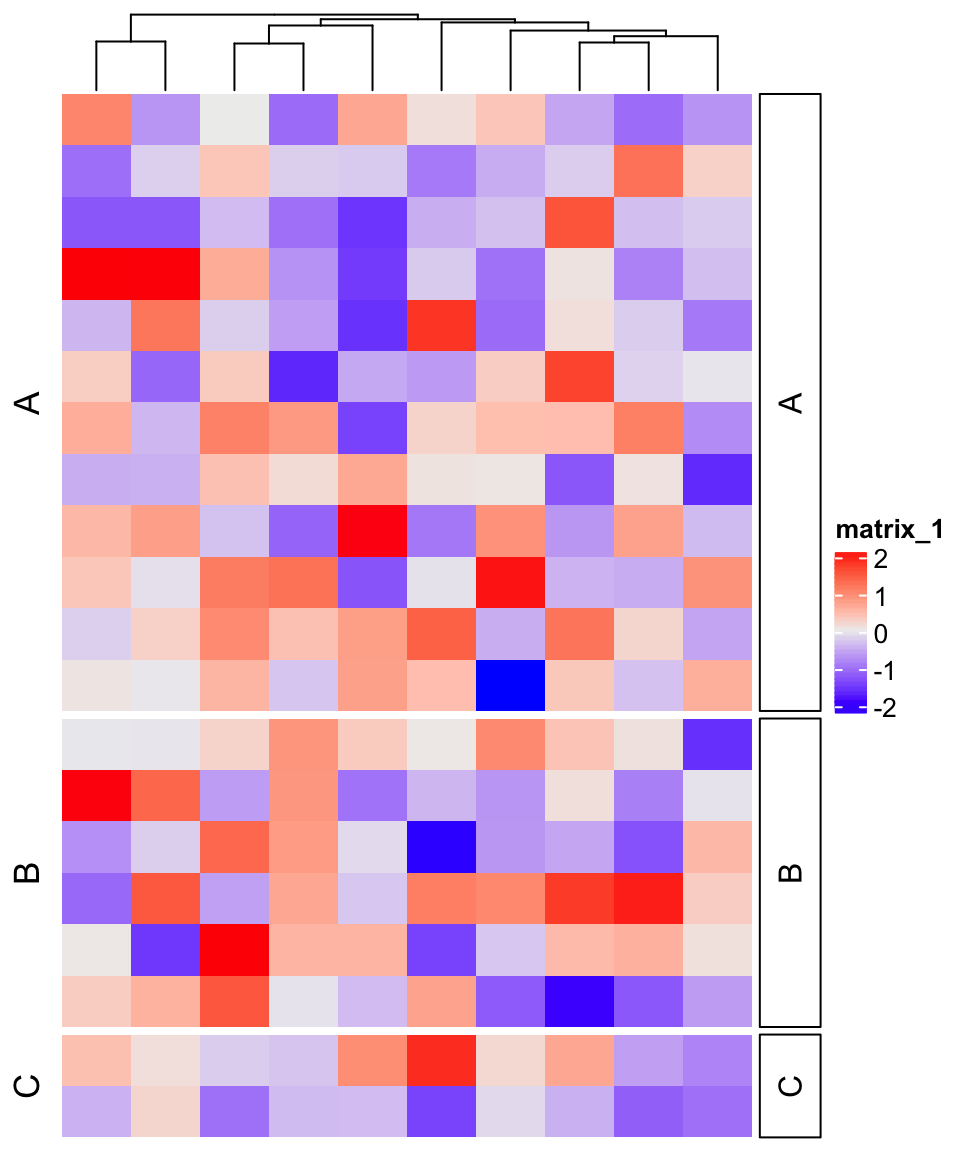
But if row clustering is applied, the labels in anno_block() correspond wrongly to the heatmap slices.
Heatmap(m, row_split = split, cluster_rows = TRUE,
    right_annotation = rowAnnotation(foo = anno_block(labels = c("A", "B", "C"))))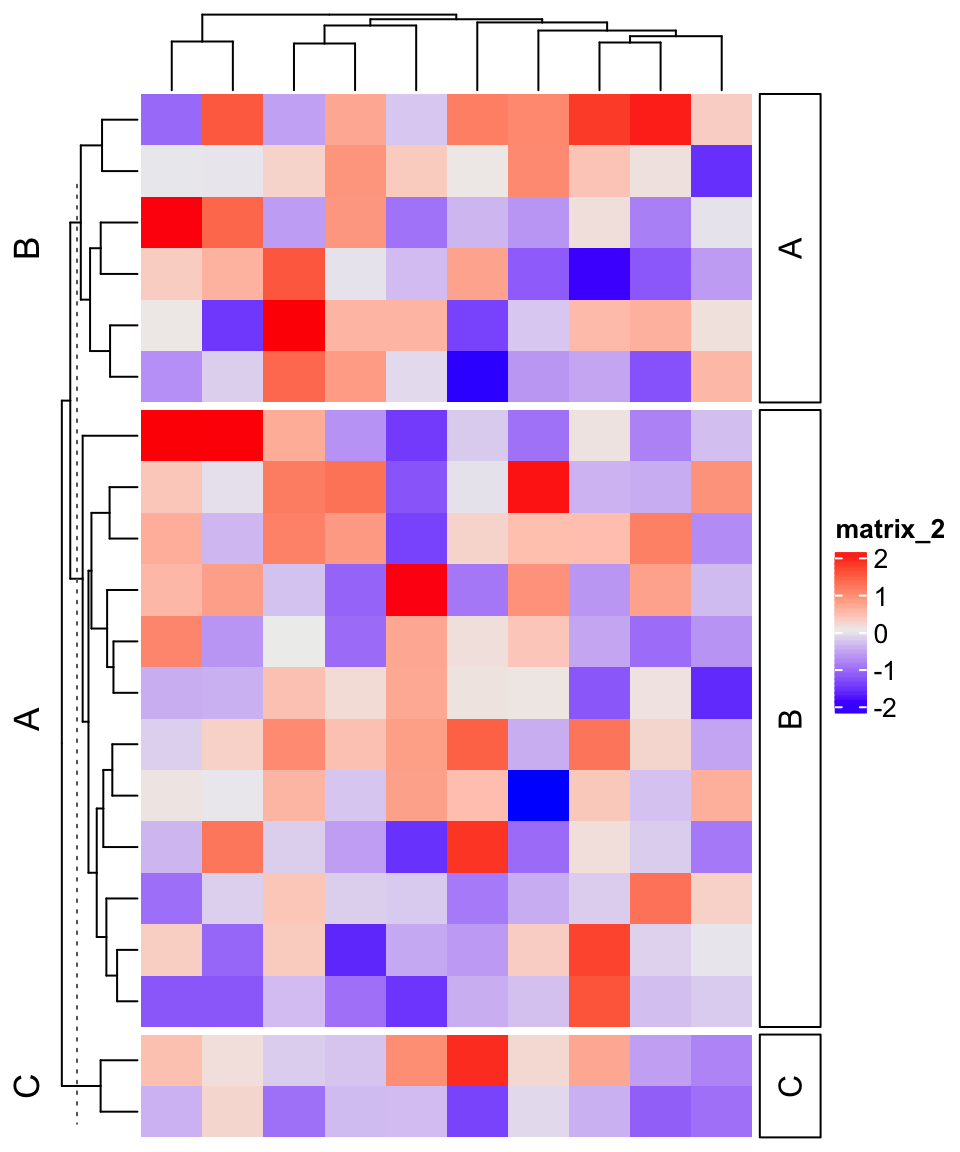
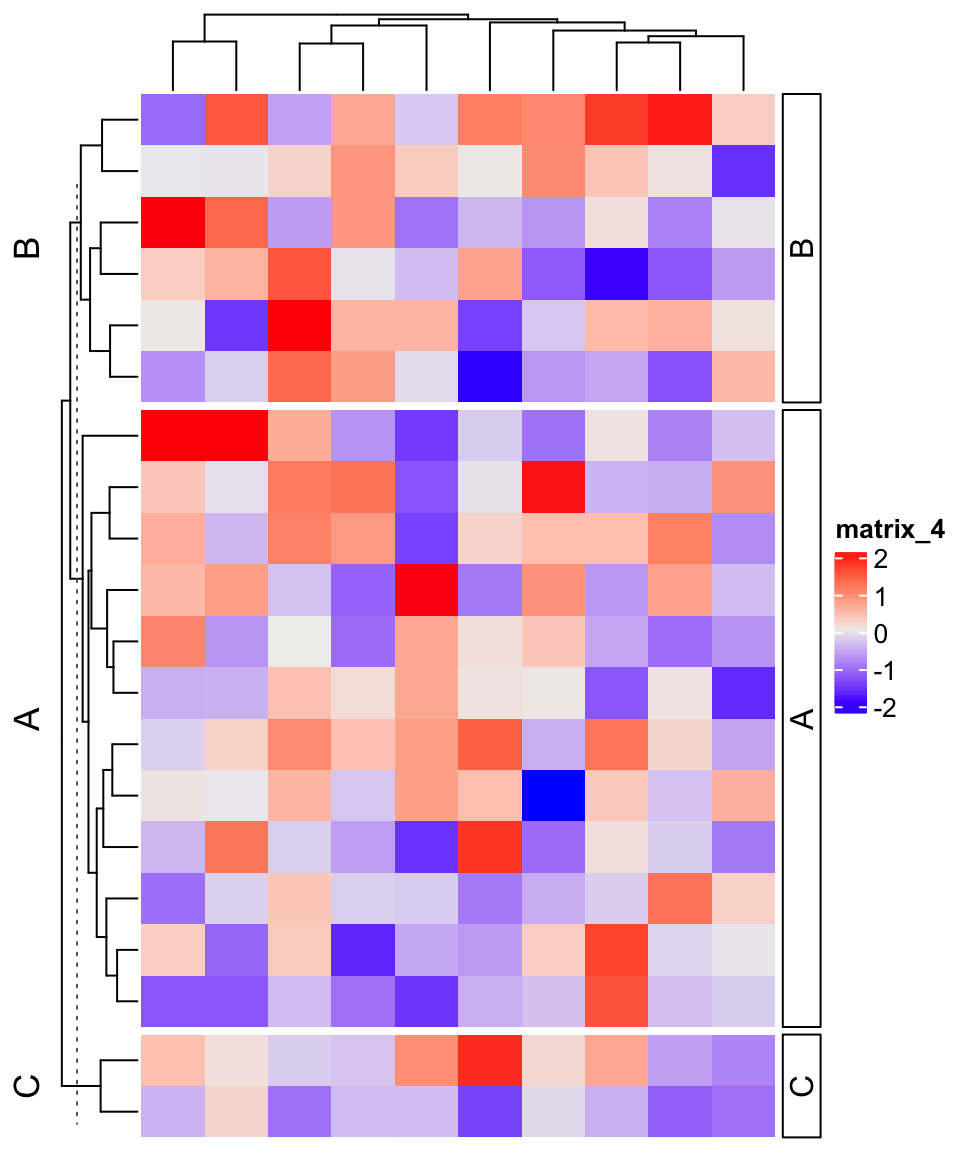
We need to manually change the value for labels to correctly correspond to heatmap slices.
Heatmap(m, row_split = split, cluster_rows = TRUE,
    right_annotation = rowAnnotation(foo = anno_block(labels = c("B", "A", "C"))))
This would be a problem if we want to programmatically set anno_block(). To
solve this problem, in the new version of ComplexHeatmap, I added a new
argument graphics in anno_block(). The value for graphics should be a
self-defined function with two arguments: 1. row/column indices in current slice, and
2. the levels from the splitting variable in current slice. The graphics
function will be executed to every slice.
Let’s implement the previous example with graphics:
Heatmap(m, row_split = split, cluster_rows = TRUE,
    right_annotation = rowAnnotation(foo = anno_block(
        graphics = function(index, levels) {
            grid.rect()
            grid.text(levels, rot = 90)
        }))
)
As you can see, the labels in anno_block() now always correspond to the
correct heatmap slice if clustering is appled.
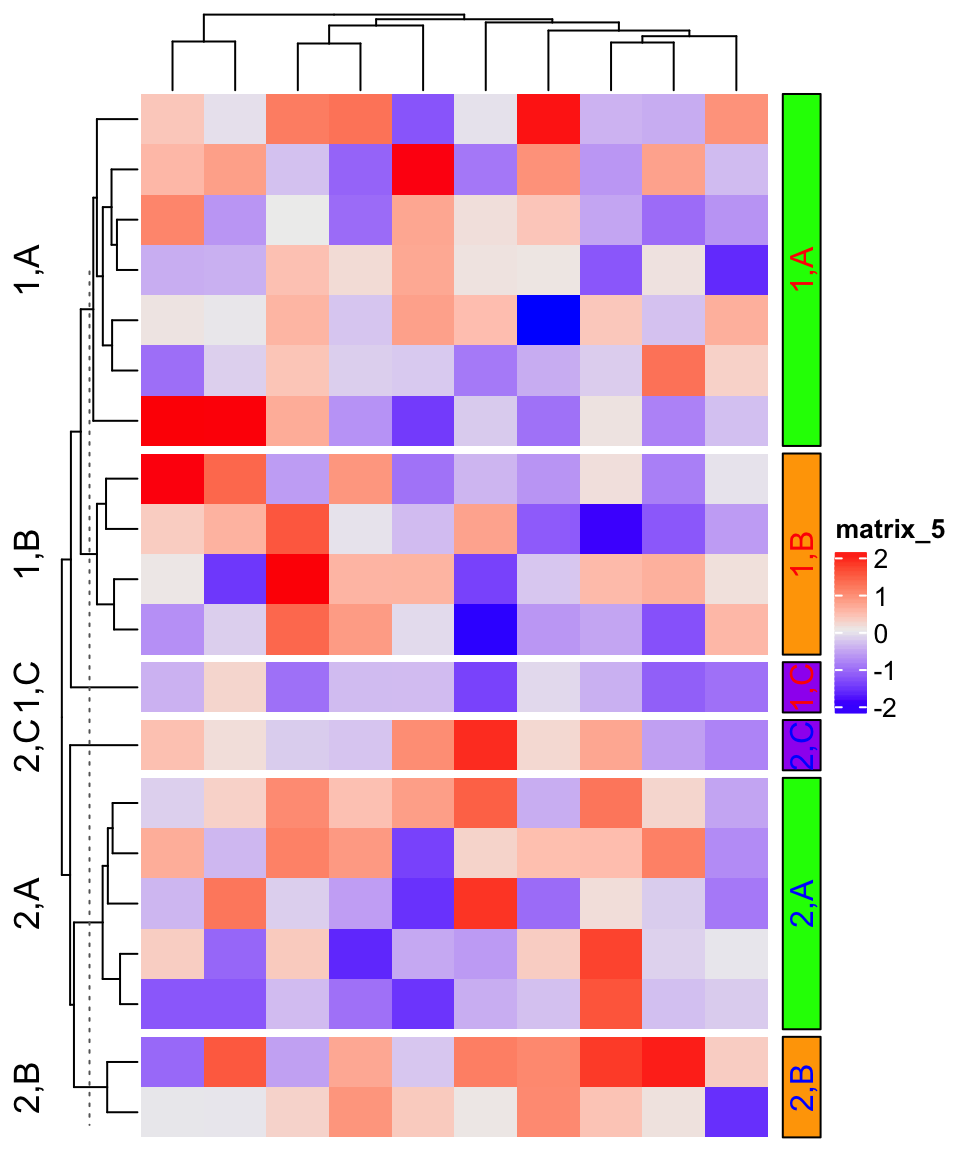
We can create more split variables. In the following example, the heatmap
is split by a k-means clustering and a split variable, so there are two split variables.
In this case, the value of levels in anno_block() will be a vector of length two: the correspond
levels in the two split variables. Now it is also possible to customize according to the corresponding
levels:
col = c("1" = "red", "2" = "blue", "A" = "green", "B" = "orange", "C" = "purple")
Heatmap(m, row_km = 2, row_split = split) +
rowAnnotation(foo = anno_block(
    graphics = function(index, levels) {
        grid.rect(gp = gpar(fill = col[levels[2]], col = "black"))
        grid.text(paste(levels, collapse = ","), 0.5, 0.5, rot = 90,
            gp = gpar(col = col[levels[1]]))
    }
))
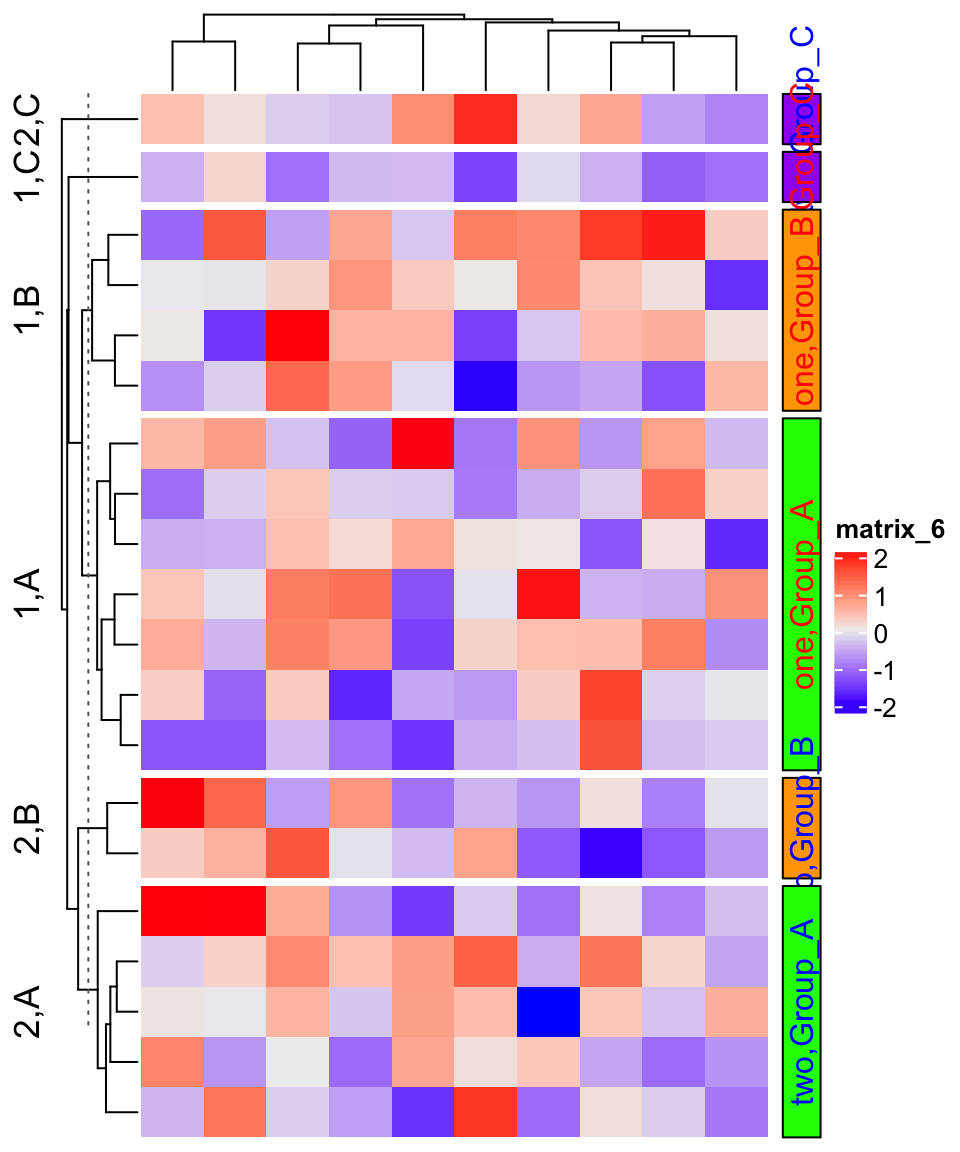
We can define a mapping variable, then the original labels of the splitting levels can be changed:
labels = c("1" = "one", "2" = "two", "A" = "Group_A", "B" = "Group_B", "C" = "Group_C")
Heatmap(m, row_km = 2, row_split = split) +
rowAnnotation(foo = anno_block(
    graphics = function(index, levels) {
        grid.rect(gp = gpar(fill = col[levels[2]], col = "black"))
        grid.text(paste(labels[levels], collapse = ","), 0.5, 0.5, rot = 90,
            gp = gpar(col = col[levels[1]]))
    }
))
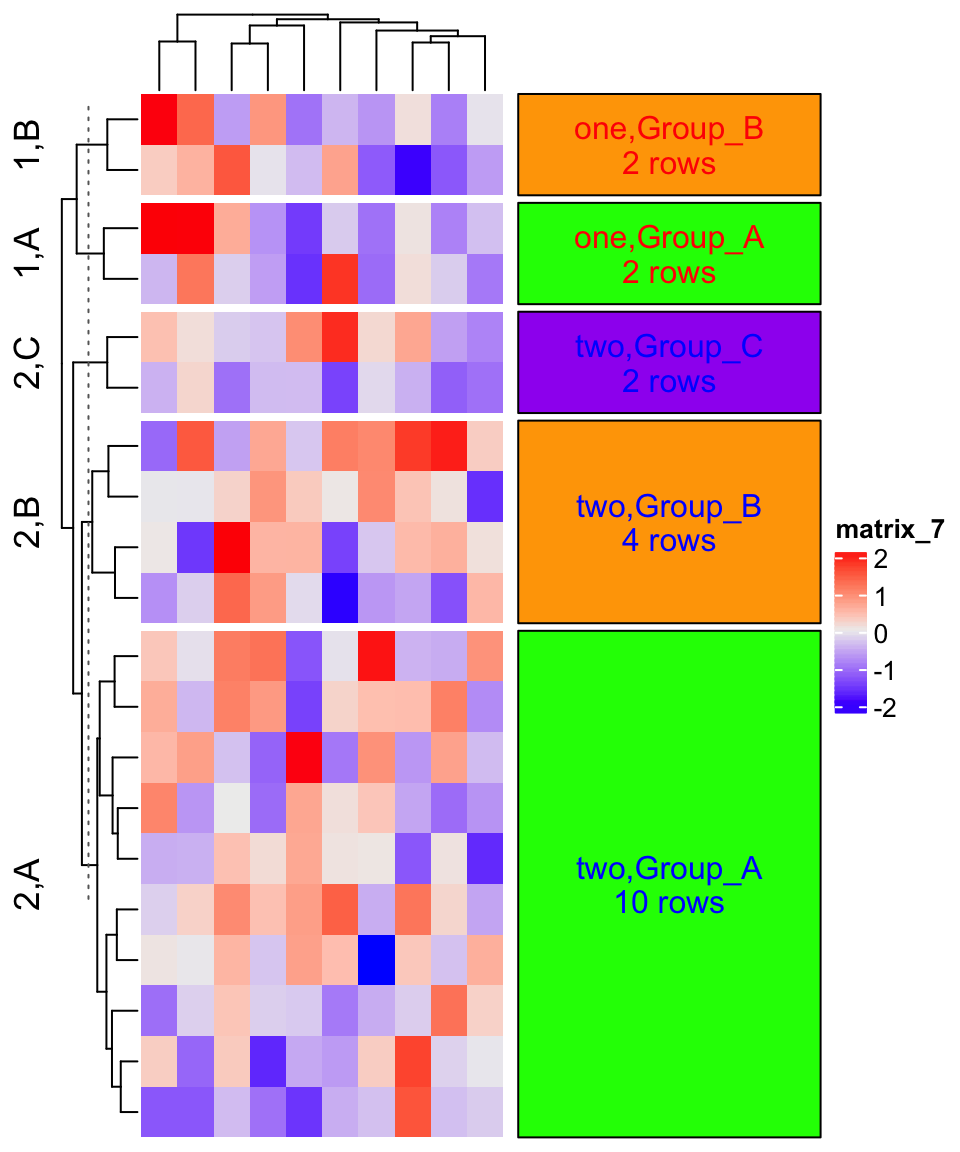
We can also construct more complex labels:
Heatmap(m, row_km = 2, row_split = split) +
rowAnnotation(foo = anno_block(
    graphics = function(index, levels) {
        grid.rect(gp = gpar(fill = col[levels[2]], col = "black"))
        txt = paste(labels[levels], collapse = ",")
        txt = paste0(txt, "\n", length(index), " rows")
        grid.text(txt, 0.5, 0.5, rot = 0,
            gp = gpar(col = col[levels[1]]))
    },
    width = unit(4, "cm")
))
One drawback of setting graphics is now anno_block() does not know what
graphics are going to be drawn, so it won’t automatically calculate the space for
the graphics, which means, if the graphics are too large, you need to manually
set width or height argument.