For the following heatmap symmetric to the diagonal, users might only want to draw the lower or upper triangle heatmap.
library(ComplexHeatmap)
m = cor(matrix(rnorm(100), 10))
Heatmap(m)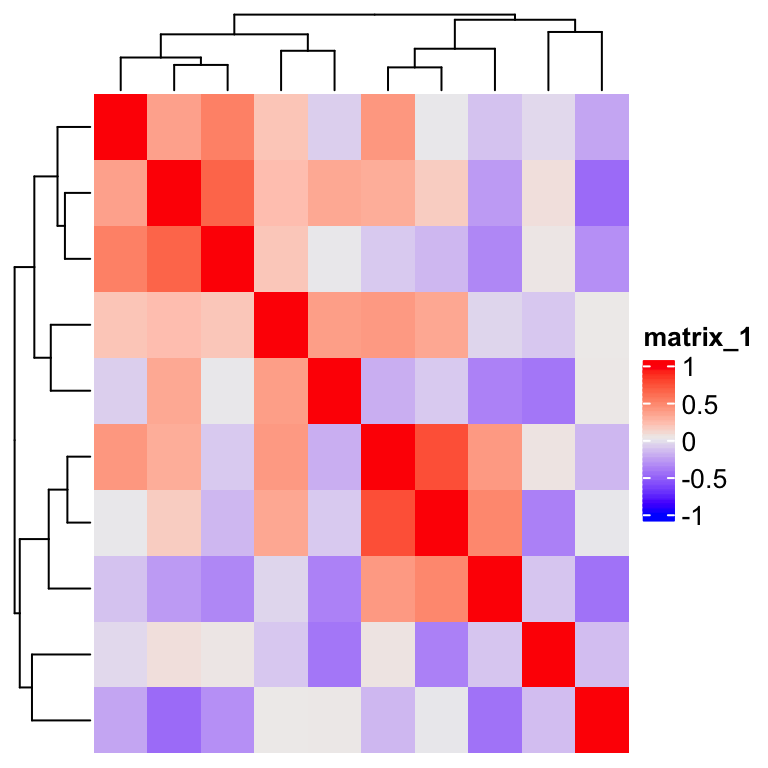
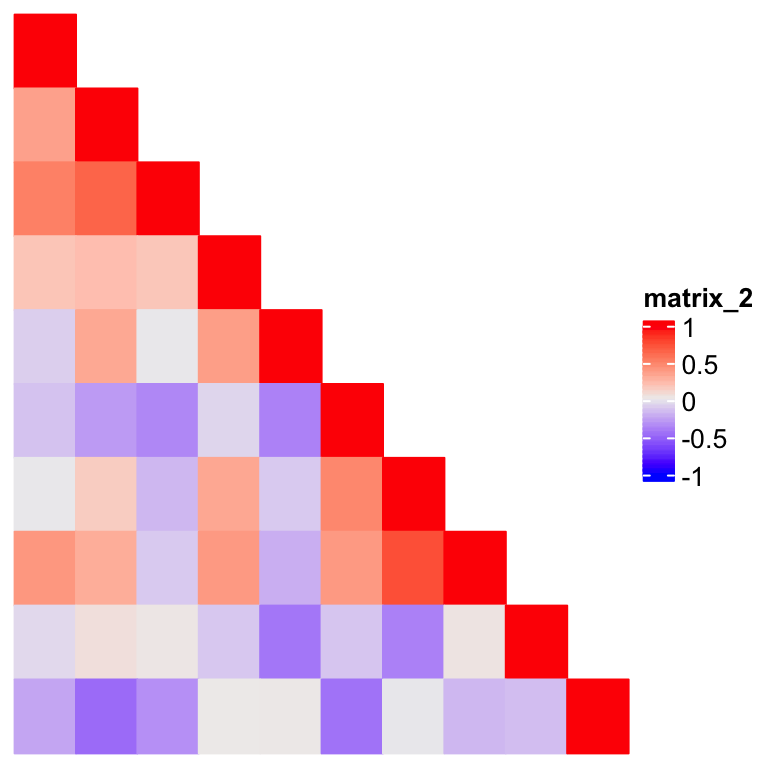
By observing the heatmap, the simplest way is to compare the row index and column index of the heatmap. Note here since the heatmap rows and columns are already reordered by clusering, we need to reorder the matrix before sending to heatmap, and in the heatmap, no reordering should be applied.
od =  hclust(dist(m))$order
m2 = m[od, od]

Heatmap(m2, rect_gp = gpar(type = "none"),
    cluster_rows = FALSE, cluster_columns = FALSE,
    cell_fun = function(j, i, x, y, w, h, fill) {
        if(i >= j) {
            grid.rect(x, y, w, h, gp = gpar(fill = fill, col = fill))
        }
    })
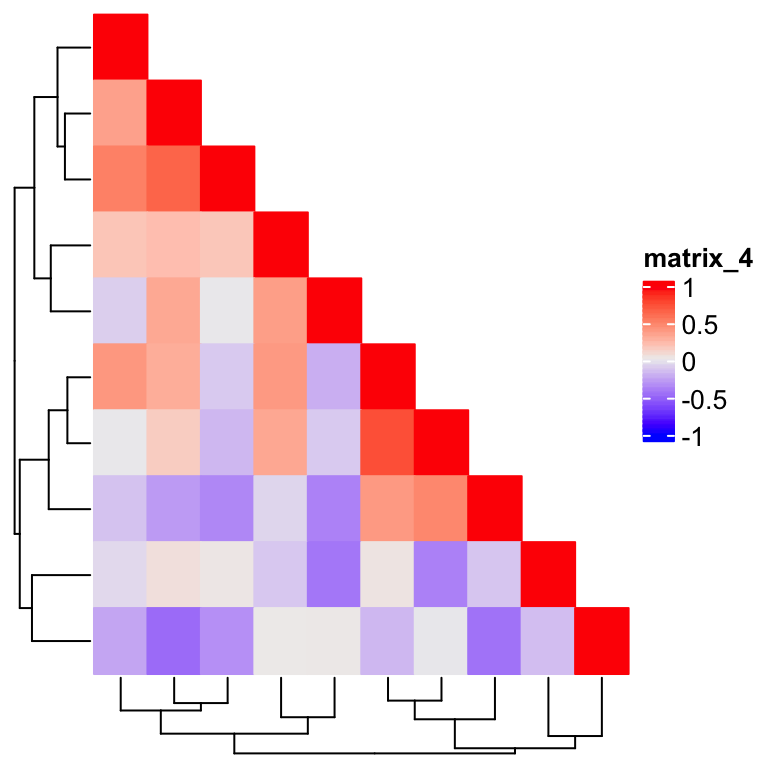
This looks good, but where are the dendrograms? How can we add the dendrograms back? In previous example, the matrix is already reordered, so the original dendrograms are lost.
Instead of the row and column indicies, we can also compare the positions of cells in the heatmap, of which the information
can be obtained by x and y parameters in cell_fun. x and y are unit objects which are the relative positions in the
two dimensions of the heatmap body viewport, e.g. unit(0.15, "npc").
They need to be converted to numbers by as.numeric() for comparisons.
Heatmap(m, rect_gp = gpar(type = "none"), column_dend_side = "bottom",
    cell_fun = function(j, i, x, y, w, h, fill) {
        if(as.numeric(x) <= 1 - as.numeric(y)) {
            grid.rect(x, y, w, h, gp = gpar(fill = fill, col = fill))
        }
    })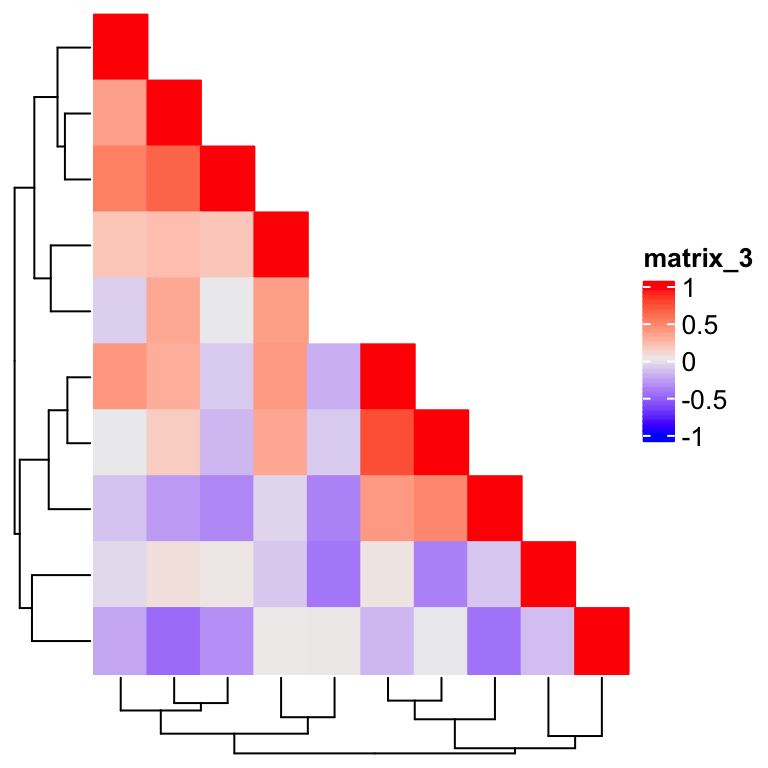
Now the dendrograms are back, but wait, the cell in the 5th row and 5th column is not drawn. This is because we are comparing two floating numbers. The solution is to add a small positive offset on the right side of the comparison:
Heatmap(m, rect_gp = gpar(type = "none"), column_dend_side = "bottom",
    cell_fun = function(j, i, x, y, w, h, fill) {
        if(as.numeric(x) <= 1 - as.numeric(y) + 1e-6) {
            grid.rect(x, y, w, h, gp = gpar(fill = fill, col = fill))
        }
    })
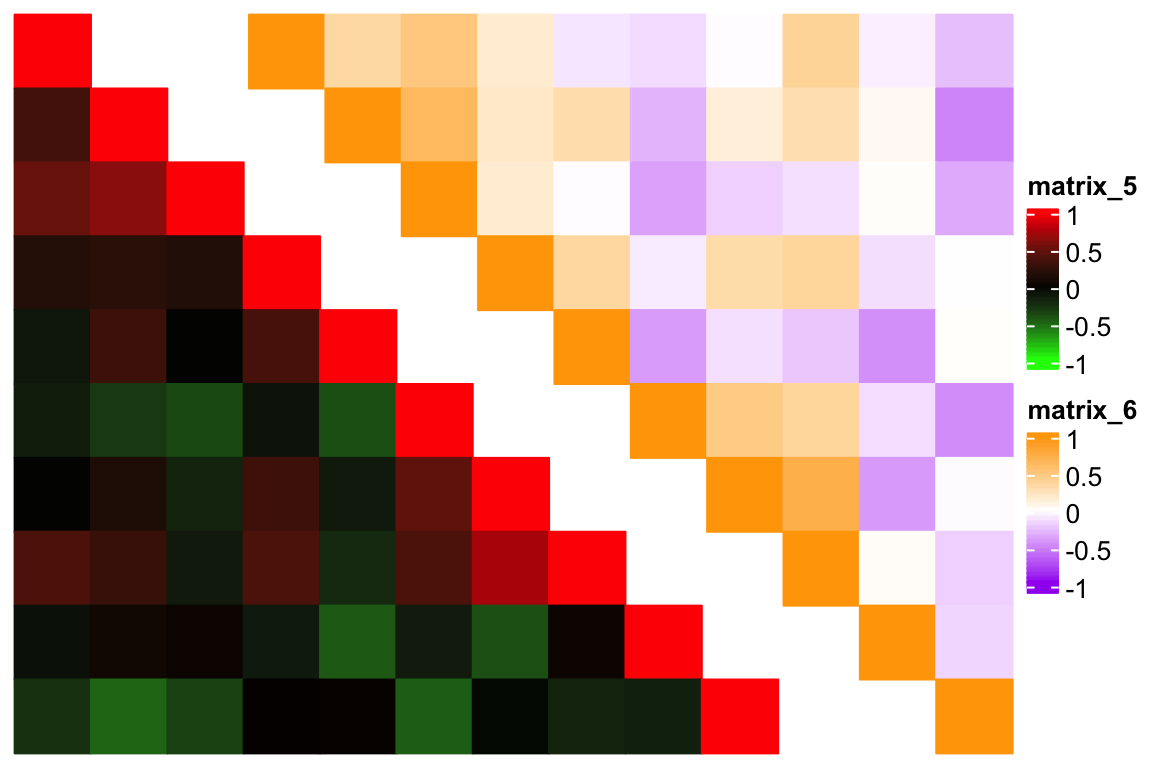
The next question is how to combine a upper triangle heatmap and a lower triangle heatmap? @ekaterinaesenkova suggested a smart way which combines two triangle heatmaps but setting ht_gap to a negative unit. Check the following example:
library(circlize)
col1 = colorRamp2(c(-1, 0, 1), c("green", "black", "red"))
col2 = colorRamp2(c(-1, 0, 1), c("purple", "white", "orange"))

od =  hclust(dist(m))$order
m2 = m[od, od]

ht1 = Heatmap(m2, rect_gp = gpar(type = "none"), col = col1,
    cluster_rows = FALSE, cluster_columns = FALSE,
    cell_fun = function(j, i, x, y, w, h, fill) {
        if(i >= j) {
            grid.rect(x, y, w, h, gp = gpar(fill = fill, col = fill))
        }
    })

ht2 = Heatmap(m2, rect_gp = gpar(type = "none"), col = col2,
    cluster_rows = FALSE, cluster_columns = FALSE,
    cell_fun = function(j, i, x, y, w, h, fill) {
        if(i <= j) {
            grid.rect(x, y, w, h, gp = gpar(fill = fill, col = fill))
        }
    })

draw(ht1 + ht2, ht_gap = unit(-70, "mm"))