circlize applies circular visualization. Essentially, it visualizes data in categories. E.g. for genomic data, the circle is segmented and each segment (or called sector) corresponds to one single chromosome. The following code visualizes 24 chromosomes of human genome.
library(circlize)
circos.initializeWithIdeogram()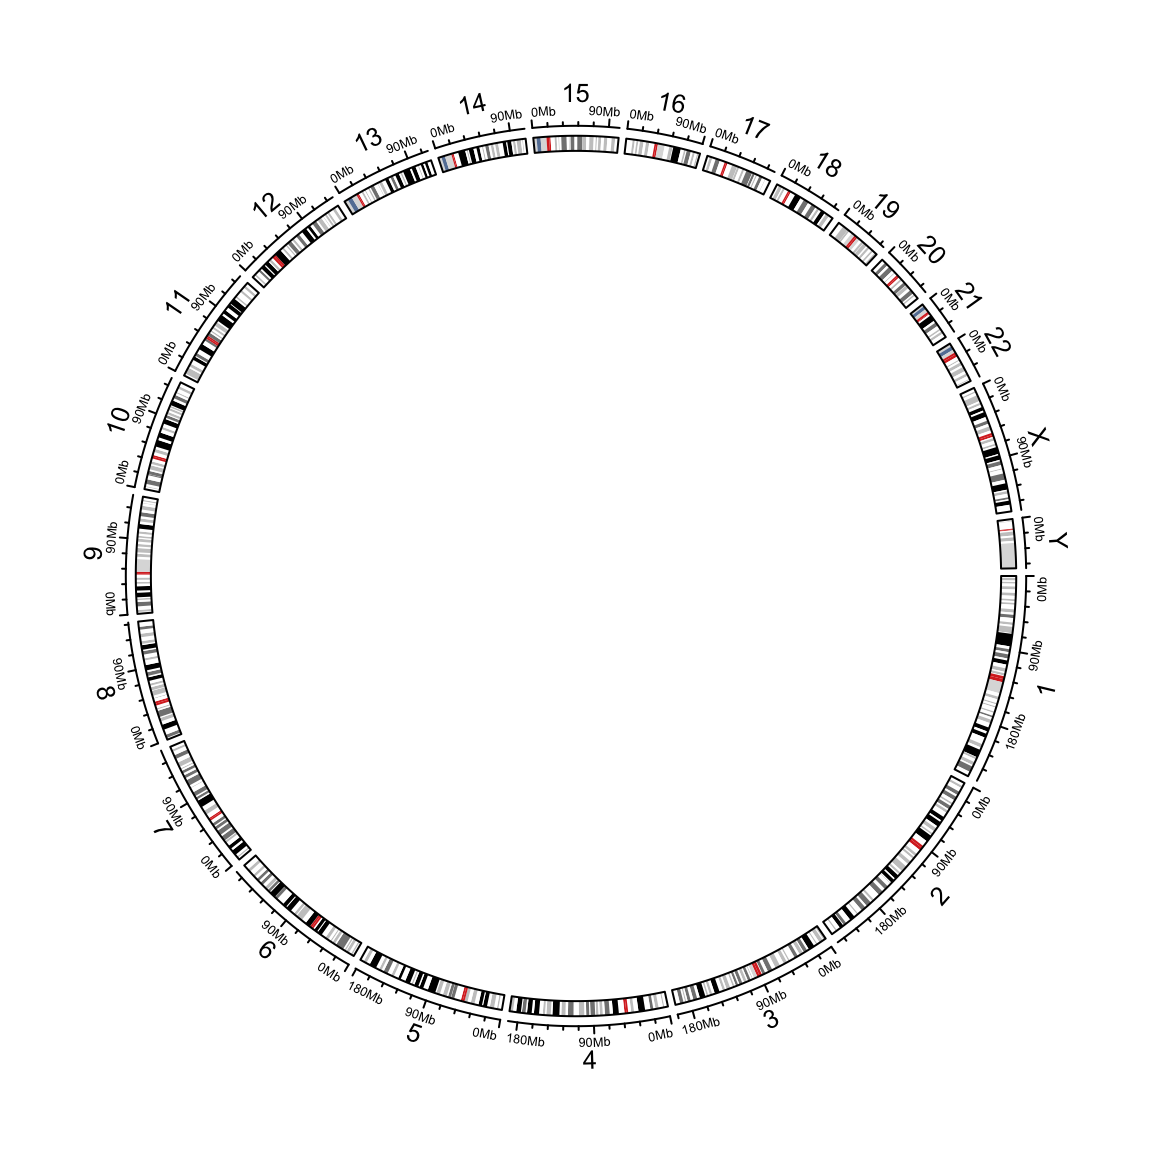
Now the question is how to visualize a “real” circular genome where the complete circle corresponds to the genome and the “end” of the genome goes smoothly over the “start” of the genome.
Maybe we can create a single sector and set gap.degree to 0. In the following, I tried to draw a line from x = 9 to x = 1. In
the circular genome, we expect the line goes through x = 0.
circos.par(gap.degree = 0, cell.padding = c(0.02, 0, 0.02, 0))
circos.initialize("foo", xlim = c(0, 10))
circos.track(ylim = c(0, 1))
circos.lines(c(9, 1), c(0.2, 0.2), col = "blue")
circos.arrow(9, 1, y = 0.7, width = 0.2)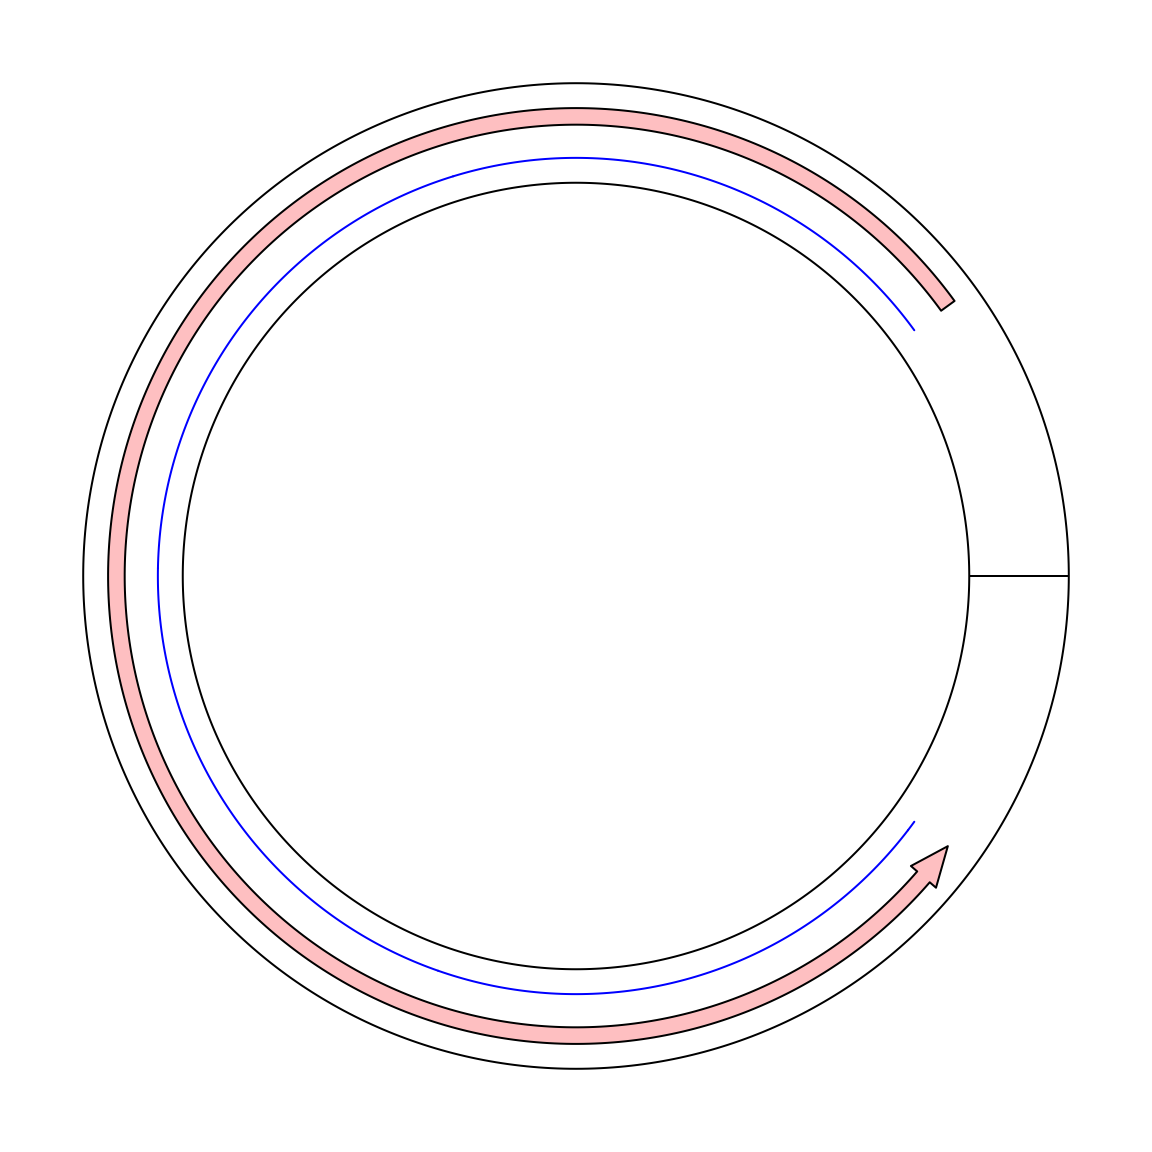
circos.clear()Unfortunately it is not what we expected. If a line is drawn from x = 9 to x = 1 in the normal mode, it only goes reverse close wisely
on the circle. And there is also a radical line in the ring which is actually the border of x = 0 and x = 10. Thus in the coordination
system, x = 1 and x = 9 are still far from each other.
To support the “real” visualization on circular genomes, in circlize, now I add a new mode called “the ring mode”.
Simply add ring = TRUE in circos.initialize().
circos.initialize("foo", xlim = c(0, 10), ring = TRUE)
circos.track(ylim = c(0, 1))
circos.lines(c(9, 1), c(0.2, 0.2), col = "blue")
circos.arrow(9, 1, y = 0.7, width = 0.2)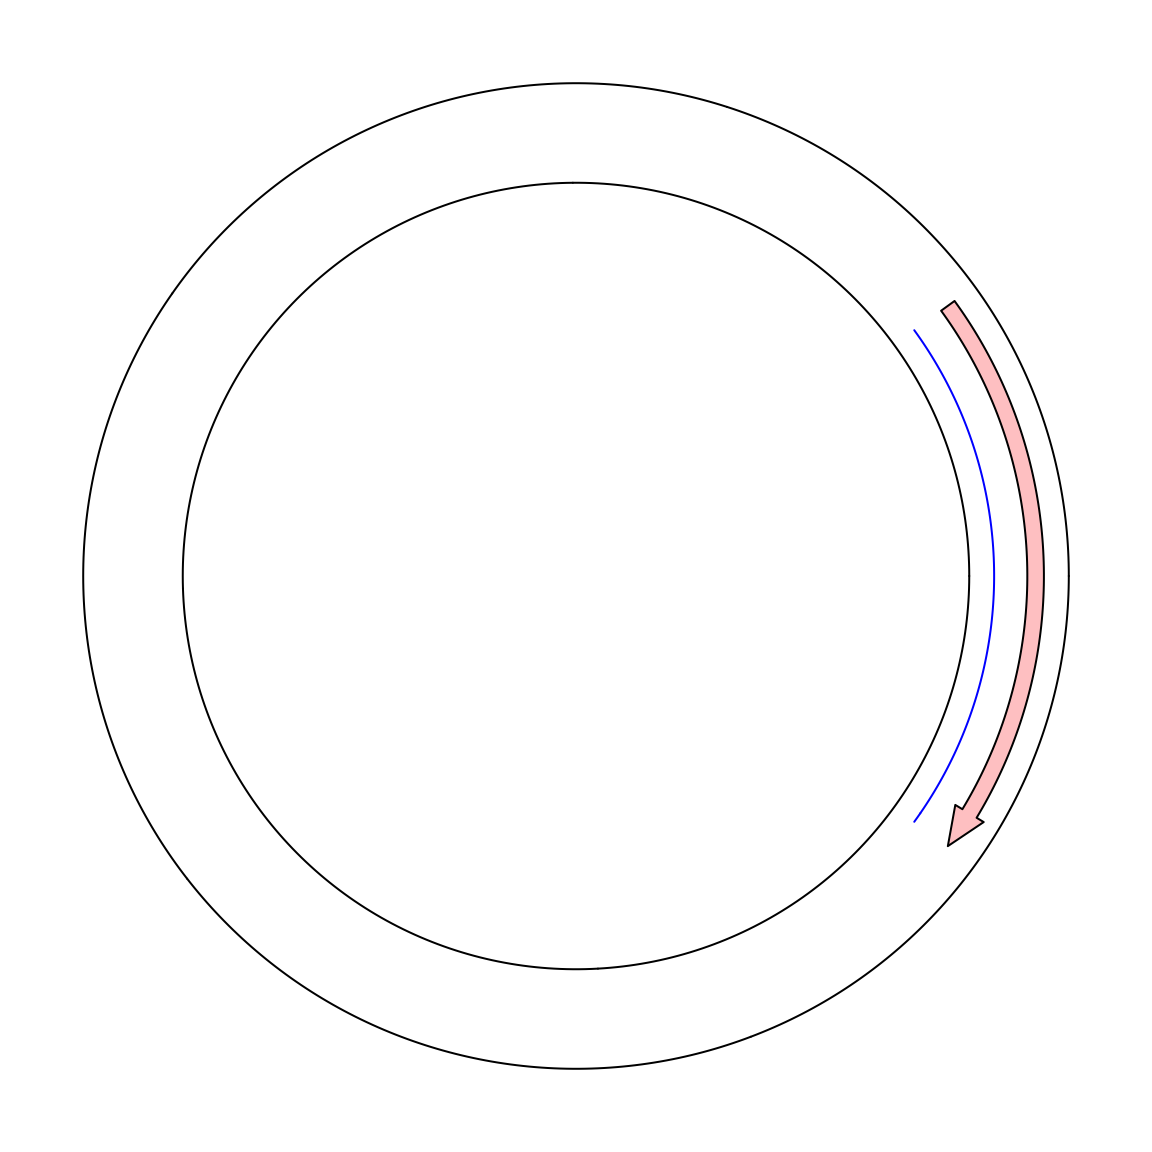
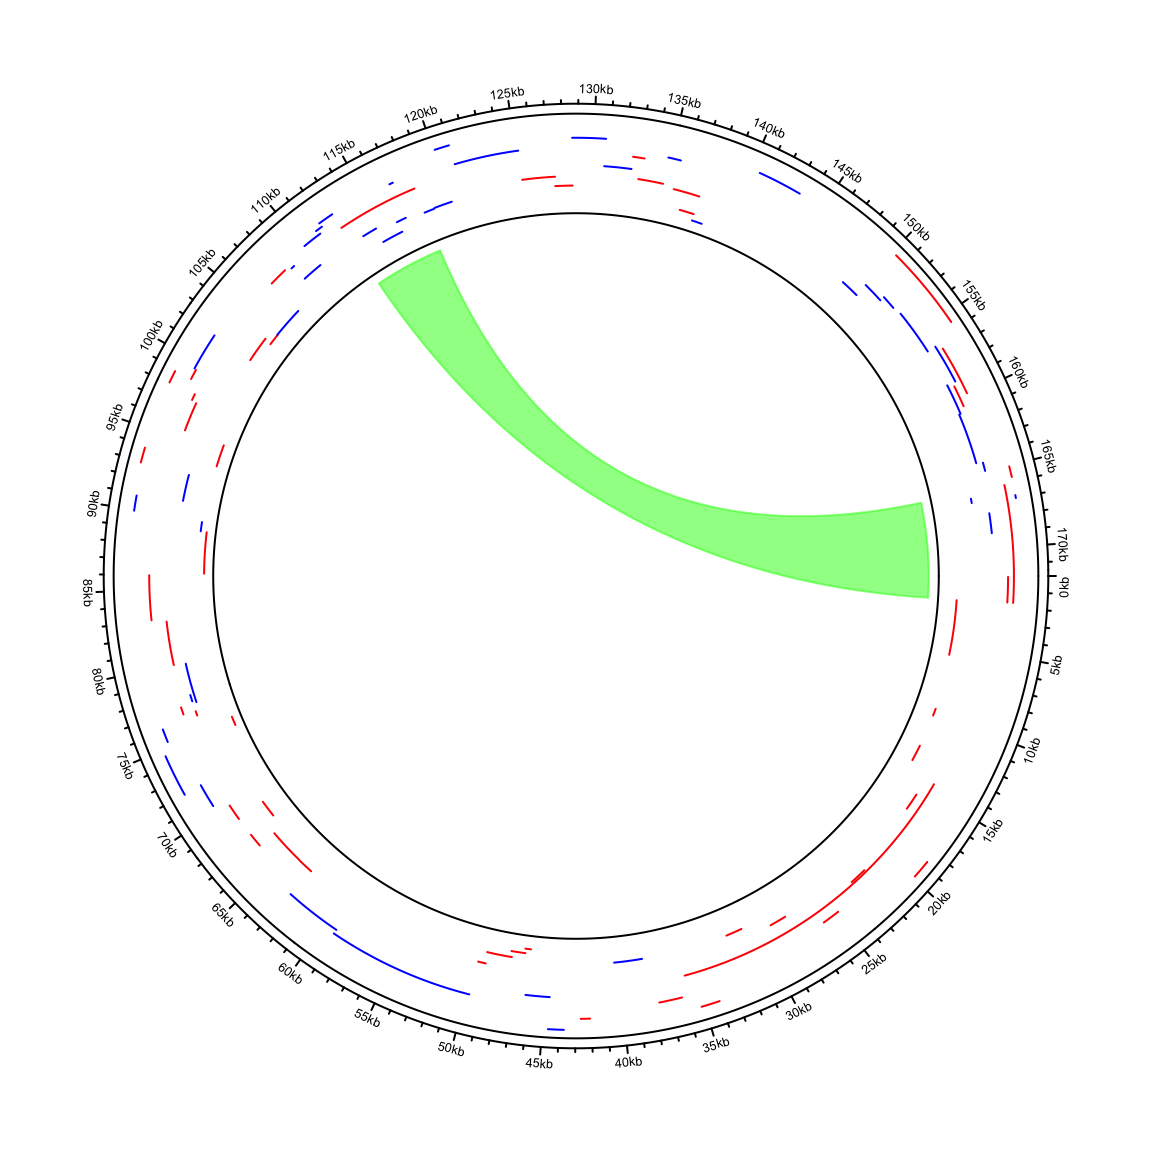
circos.clear()In the next example, I visualize genome of the Human gammaherpesvirus 4. The genomic coordinates of genes are from https://www.ncbi.nlm.nih.gov/genome/browse/#!/proteins/10261/459250%7CHuman%20gammaherpesvirus%204/. As you can see here, start position in the first row in larger than the end position.
df = read.csv("~/Downloads/proteins_10261_459250.csv")
head(df)
## X.Name Accession Start Stop Strand GeneID Locus Locus.tag
## 1 viral segment NC_007605.1 166103 1680 + 3783751 LMP-2A HHV4_LMP-2A
## 2 viral segment NC_007605.1 59 1680 + 3783760 LMP-2B HHV4_LMP-2B
## 3 viral segment NC_007605.1 1736 5692 + 3783722 BNRF1 HHV4_BNRF1
## 4 viral segment NC_007605.1 9675 10187 + 3783689 BCRF1 HHV4_BCRF1.1
## 5 viral segment NC_007605.1 12541 13692 + 3783691 BWRF1 HHV4_BWRF1.1
## 6 viral segment NC_007605.1 14409 35694 + 3783746 EBNA-LP HHV4_EBNA-LP
## Protein.product Length Protein.Name
## 1 YP_401631.1 497 membrane protein LMP-2A
## 2 YP_401632.1 378 membrane protein LMP-2B
## 3 YP_401633.1 1318 tegument protein G75
## 4 YP_401634.1 170 interleukin-10 BCRF1
## 5 YP_401635.1 383 protein BWRF1, partial
## 6 YP_401636.1 506 nuclear antigen EBNA-LPdf = df[, 2:5]I wrote a helper function circos.initializeCircularGenome() especially for circular genomes.
In other parts of the code, just use circlize in the normal way.
circos.initializeCircularGenome("NC_007605.1", genome_size = 171823)
circos.genomicTrack(df, ylim = c(0, 1), panel.fun = function(region, value, ...) {
    circos.genomicLines(region, value = runif(nrow(region)), type = "segment",
        col = ifelse(value[, 1] == "+", "Red", "blue"))
})
circos.genomicLink(df[1, ], df[60, ], col = "#00FF0080")