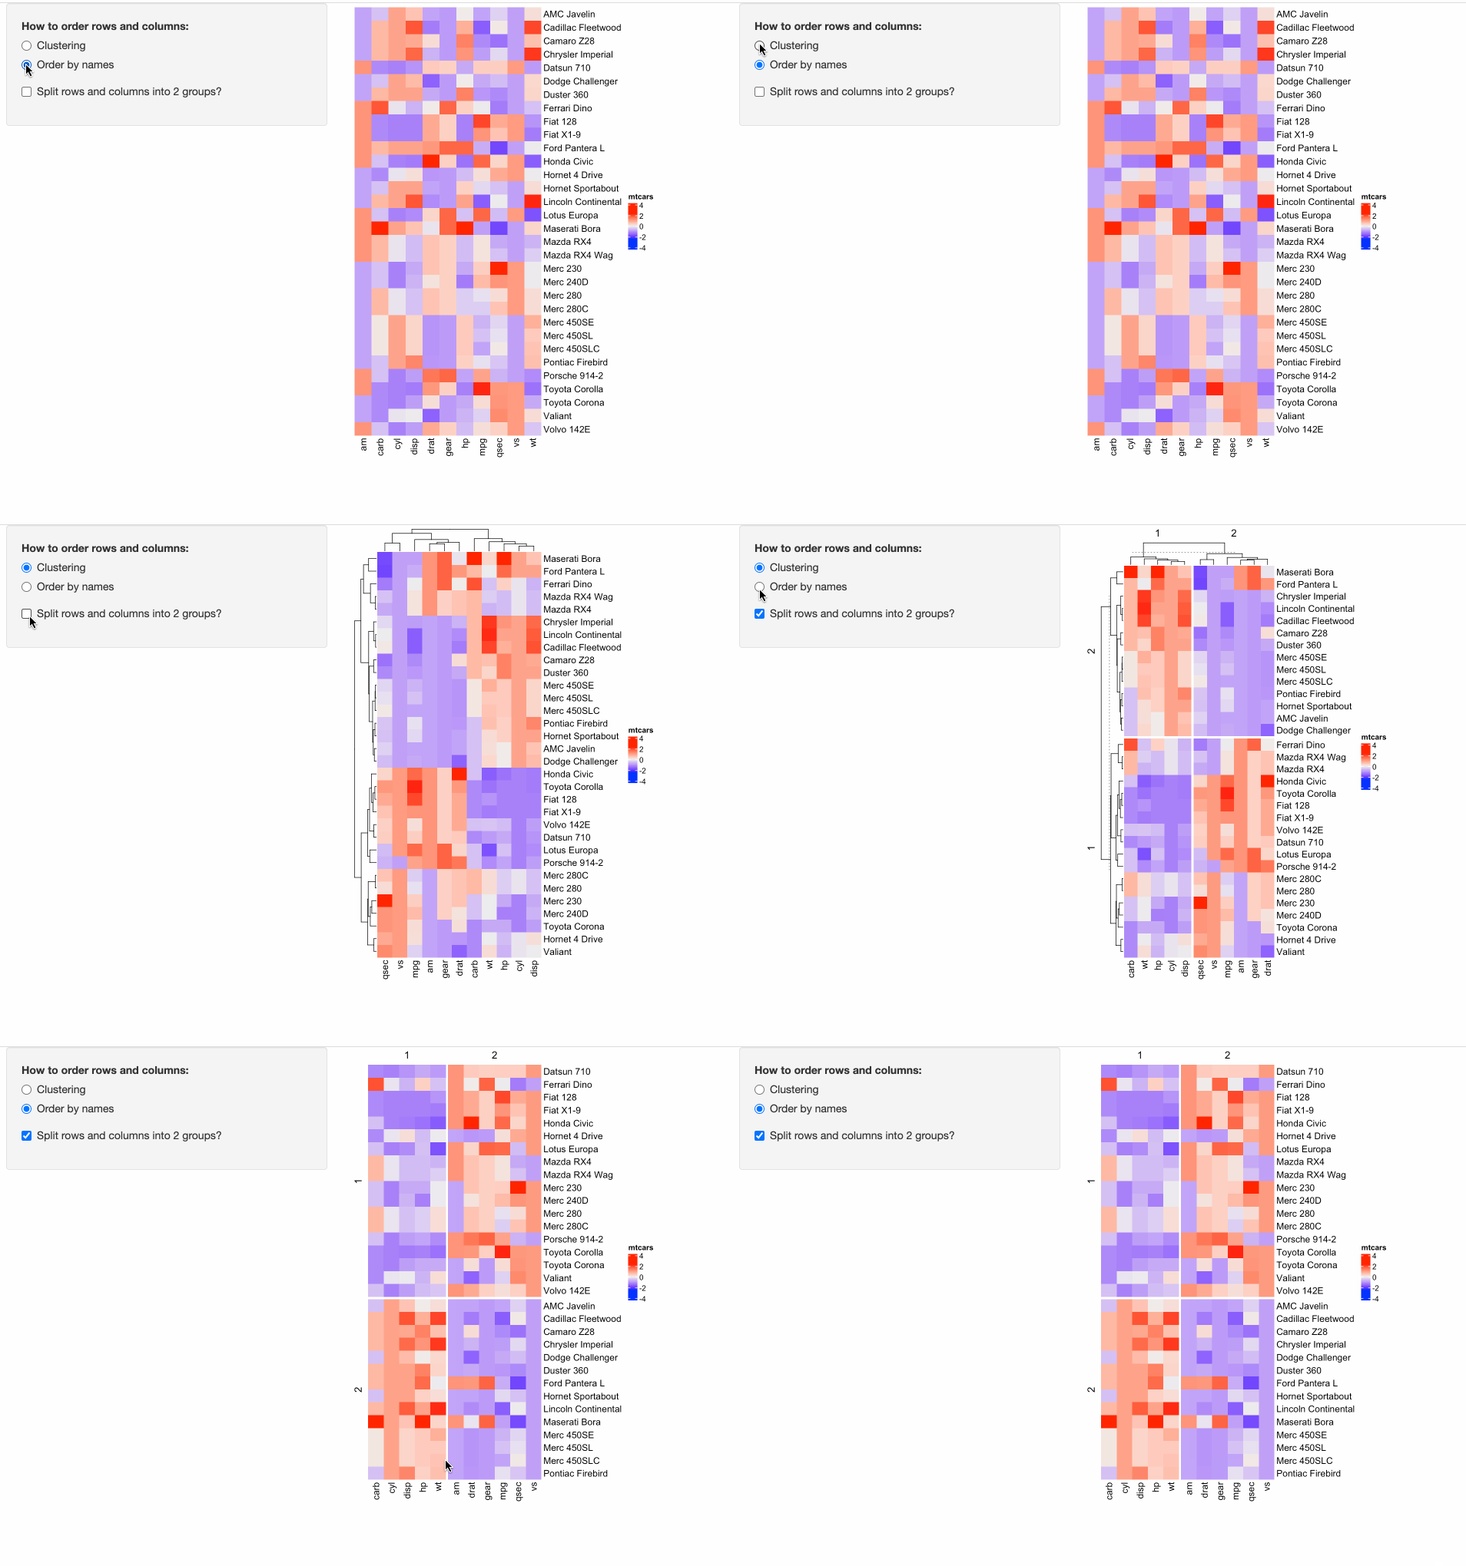
Some people might have already implemented ComplexHeatmap in their Shiny apps, where a static heatmap is automatically generated by adjusting parameters for heatmaps. For example, in the following example, in the left panel, users can control three types of parameters for heatmaps:
- Whether to apply clustering?
- Whether to order heatmaps by row and column names?
- Whether to perform k-means clustering with 2-group on both rows and columns?
The following code can be directly copied and pasted to an R session. It is runnable.
m = scale(as.matrix(mtcars))  # the matrix is scaled by columns

library(shiny)
library(ComplexHeatmap)

ui = fluidPage(
    sidebarLayout(
        sidebarPanel(
            radioButtons("order_method", "How to order rows and columns:",
                c("Clustering" = "clustering", "Order by names" = "by_name"),
                selected = "clustering"),
            checkboxInput('split', "Split rows and columns into 2 groups?", FALSE),
            width = 3
        ),
        mainPanel(
            plotOutput('heatmap', height = "600px", width = "400px"),
        ),
    )
)

server = function(input, output, session) {
    output$heatmap = renderPlot({
        cluster_rows = FALSE
        cluster_columns = FALSE
        row_order = NULL
        column_order = NULL
        row_km = NULL
        column_km = NULL

        if(input$order_method == "clustering") {
            cluster_rows = TRUE
            cluster_columns = TRUE
        } else {
            row_order = order(rownames(m))
            column_order = order(colnames(m))
        }

        if(input$split) {
            row_km = 2
            column_km = 2
        }

        ht = Heatmap(m, name = "mtcars",
            cluster_rows = cluster_rows, cluster_columns = cluster_columns,
            row_order = row_order, column_order = column_order,
            row_km = row_km, column_km = column_km)
        draw(ht)
    })
}

shinyApp(ui = ui, server = server)
In the Shiny app above, it is “interactive” from the perspective of the app, which is, it allows users to interactively adjust the parameters and heatmaps are generated accordingly and automatically. But, the heatmap itself is static, which means, users cannot directly interact with the heatmap.
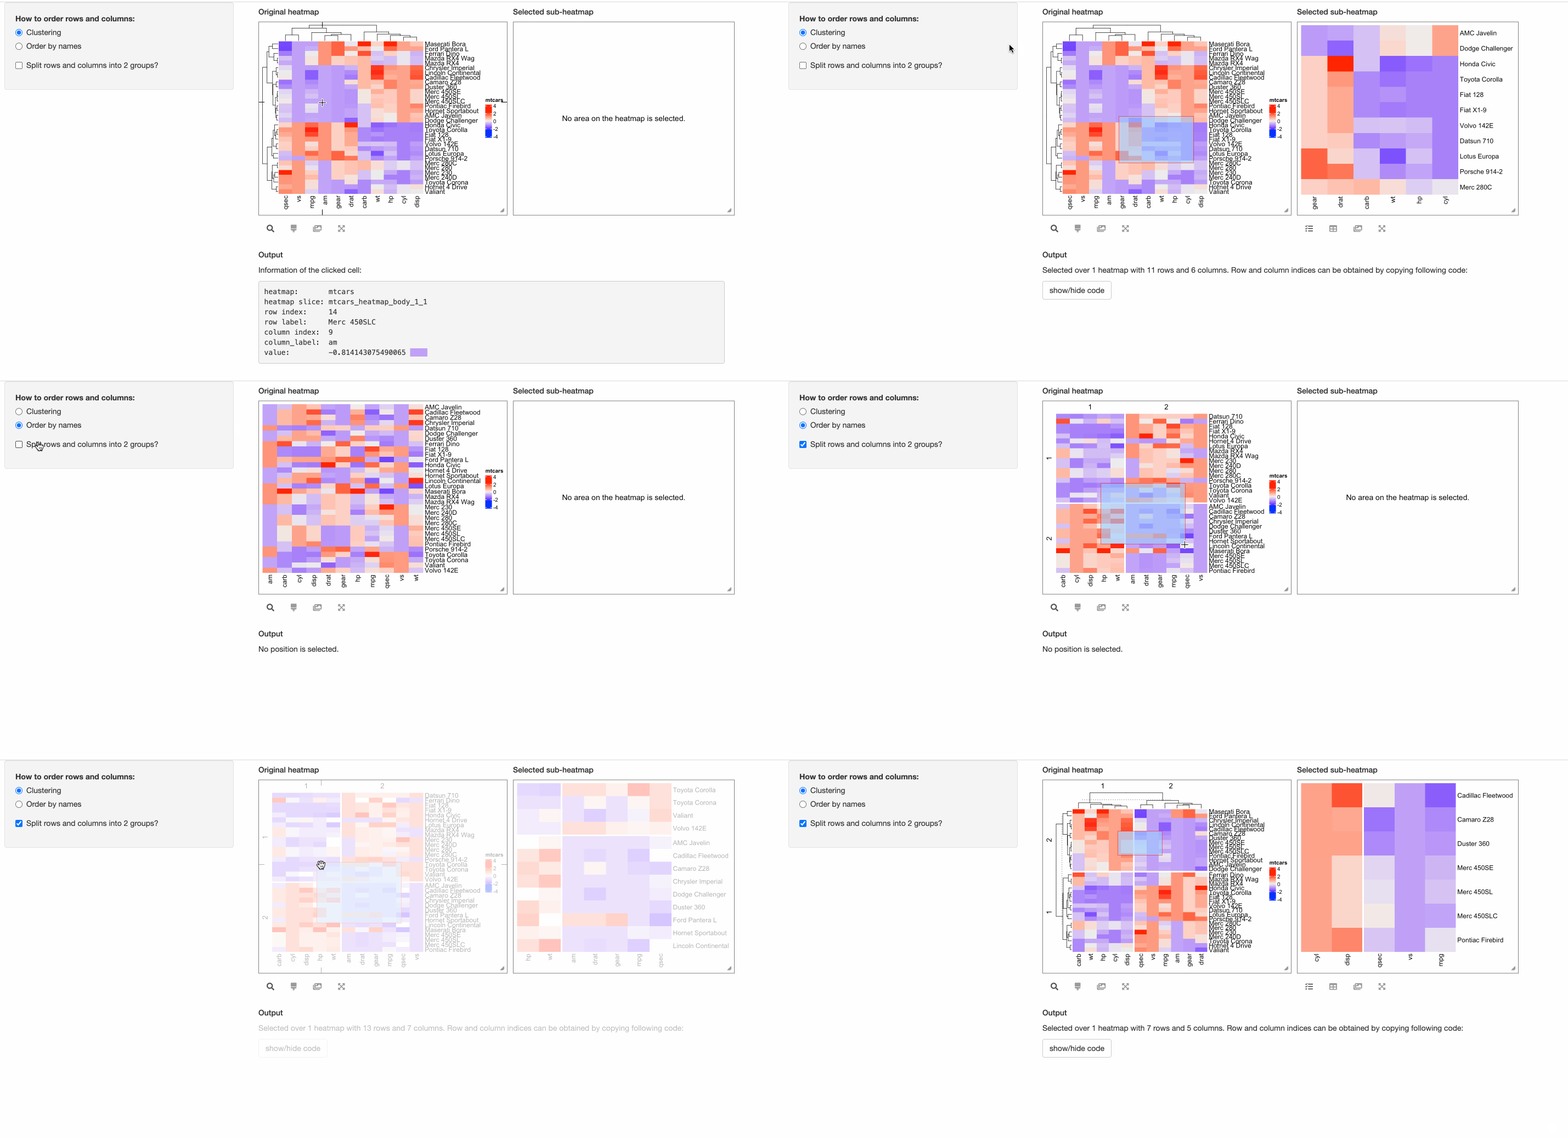
Nevertheless, with the help of InteractiveComplexHeatmap package, it is very easy to “interactivate” the static heatmap with only a few lines of code.
In the previous code, in the UI of the Shiny app, the heatmap is wrapped in a plotOutput().
Now to “interactivate” the static heatmap, we use InteractiveComplexHeatmapOutput() from
InteractiveComplexHeatmap instead. Note in the following code chunk, the lines that
I have changed are marked with “# <- this line is changed”.
Also, in the server function in the previous Shiny app, the static heatmap is generated
as output$heatmap = renderPlot({...}), now we change it to observe({...; makeInteractiveComplexHeatmap(input, output, session, ht)})
so that changes of heatmap parameters can automatically refresh the interactive heatmap.
Please check the following code where there are only three lines of change compared to the previous “static heatmap” Shiny app. Also, the following code is runnable that it can be directly copied and pasted to an R session.
library(InteractiveComplexHeatmap)
ui = fluidPage(
    sidebarLayout(
        sidebarPanel(
            radioButtons("order_method", "How to order rows and columns:",
                c("Clustering" = "clustering", "Order by names" = "by_name"),
                selected = "clustering"),
            checkboxInput('split', "Split rows and columns into 2 groups?", FALSE),
            width = 3
        ),
        mainPanel(
            InteractiveComplexHeatmapOutput(),  # <- this line is changed
        ),
    )
)

server = function(input, output, session) {
    observe({       # <- this line is changed
        cluster_rows = FALSE
        cluster_columns = FALSE
        row_order = NULL
        column_order = NULL
        row_km = NULL
        column_km = NULL

        if(input$order_method == "clustering") {
            cluster_rows = TRUE
            cluster_columns = TRUE
        } else {
            row_order = order(rownames(m))
            column_order = order(colnames(m))
        }

        if(input$split) {
            row_km = 2
            column_km = 2
        }

        ht = Heatmap(m, name = "mtcars",
            cluster_rows = cluster_rows, cluster_columns = cluster_columns,
            row_order = row_order, column_order = column_order,
            row_km = row_km, column_km = column_km)
        makeInteractiveComplexHeatmap(input, output, session, ht)    # <- this line is changed
    })
}

shinyApp(ui = ui, server = server)
In the previous “interactive heatmap” example, since the number of rows and columns are not too many that
individual cell can actually be easily identified from the heatmap, thus, maybe it is not necessary to support
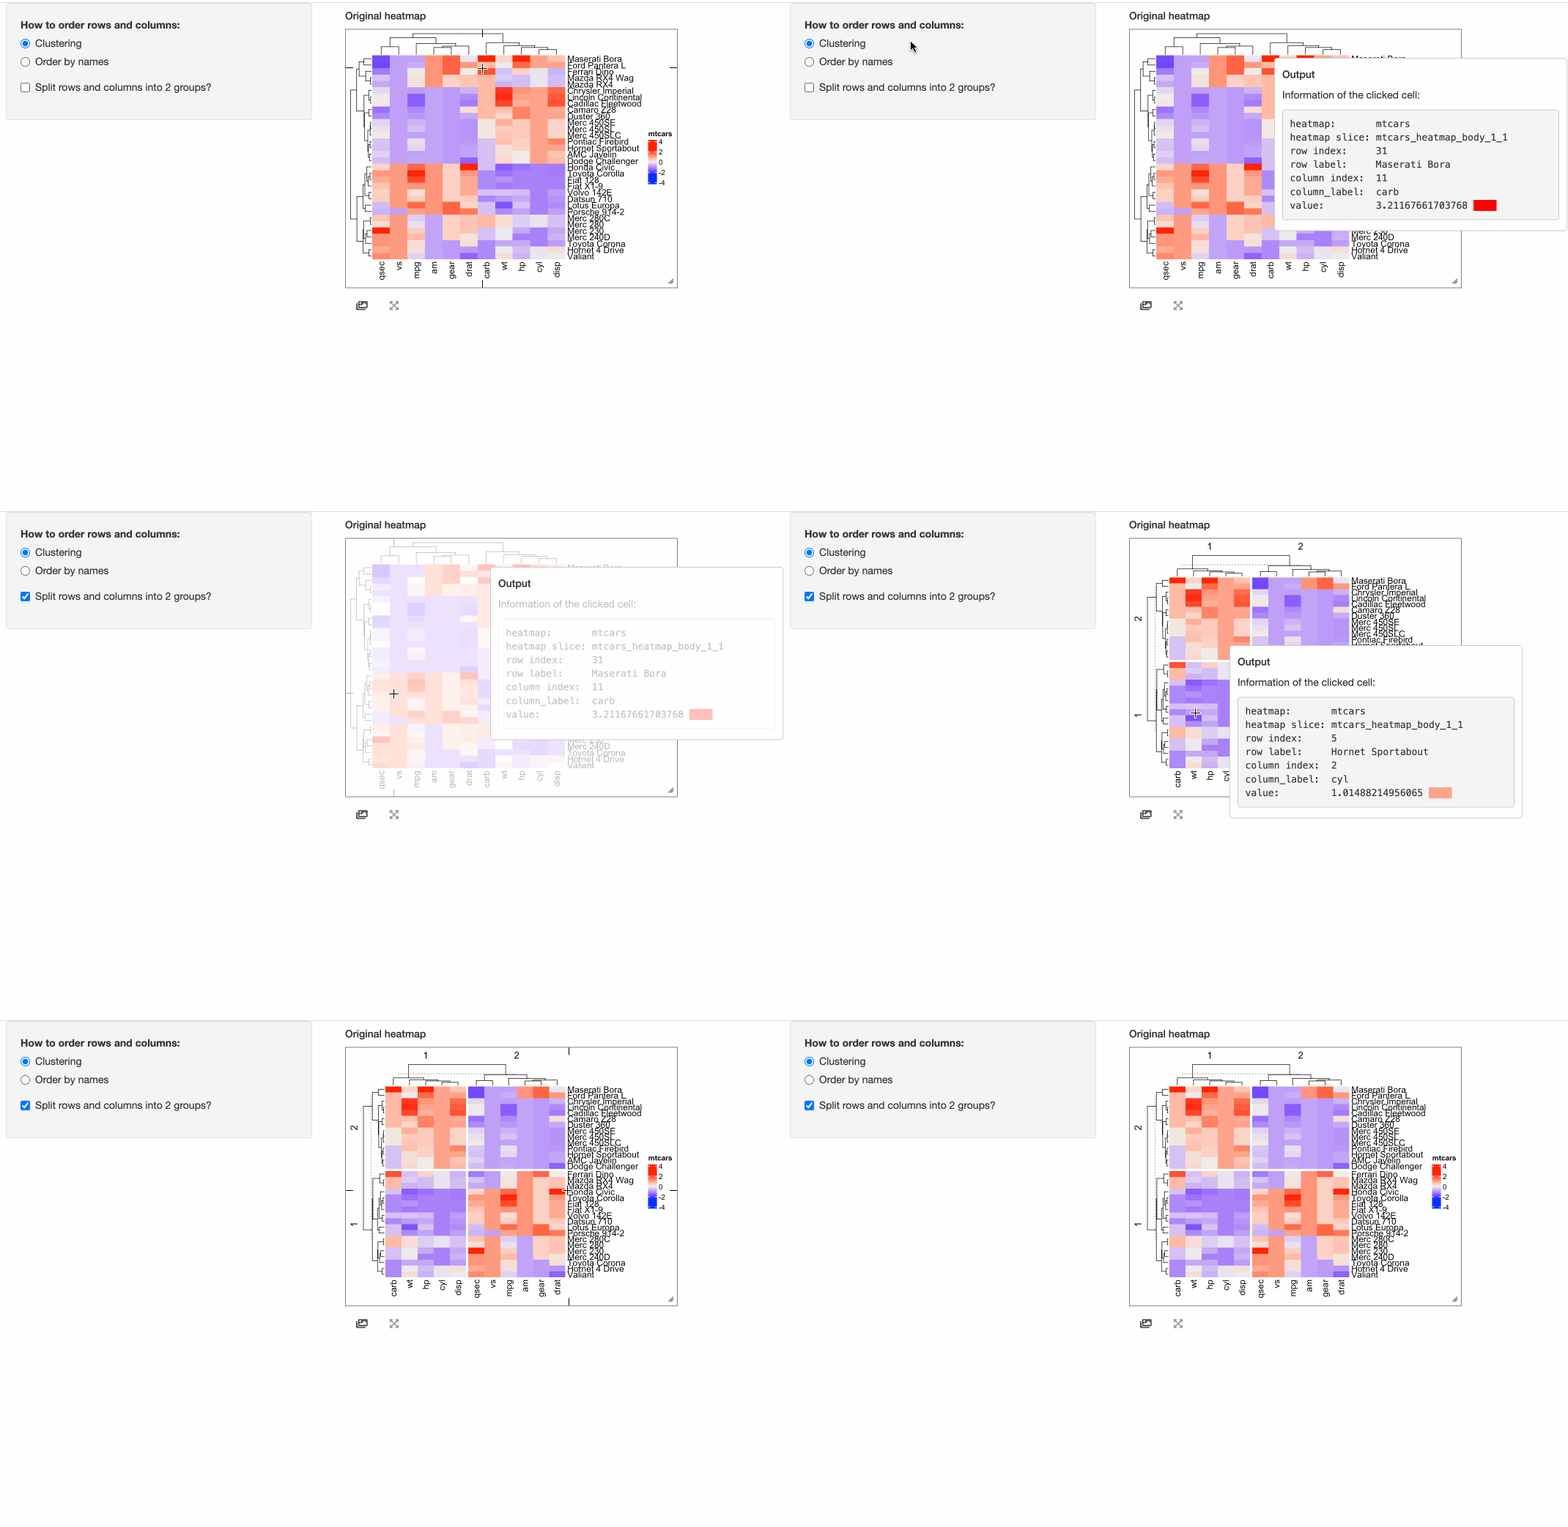
the “brush” response which allows to select an area from the heatmap. Here we set two arguments compact = TRUE, response = "click"
in InteractiveComplexHeatmapOutput() so that the interactive heatmap only responses to the click event and it pops
a box around the mouse click that contains detailed information of the clicked cell.
ui = fluidPage(
    sidebarLayout(
        sidebarPanel(
            radioButtons("order_method", "How to order rows and columns:",
                c("Clustering" = "clustering", "Order by names" = "by_name"),
                selected = "clustering"),
            checkboxInput('split', "Split rows and columns into 2 groups?", FALSE),
            width = 3
        ),
        mainPanel(
            InteractiveComplexHeatmapOutput(compact = TRUE, response = "click"),  # <- this line is changed
        ),
    )
)

server = function(input, output, session) {
    observe({
        cluster_rows = FALSE
        cluster_columns = FALSE
        row_order = NULL
        column_order = NULL
        row_km = NULL
        column_km = NULL

        if(input$order_method == "clustering") {
            cluster_rows = TRUE
            cluster_columns = TRUE
        } else {
            row_order = order(rownames(m))
            column_order = order(colnames(m))
        }

        if(input$split) {
            row_km = 2
            column_km = 2
        }

        ht = Heatmap(m, name = "mtcars",
            cluster_rows = cluster_rows, cluster_columns = cluster_columns,
            row_order = row_order, column_order = column_order,
            row_km = row_km, column_km = column_km)
        makeInteractiveComplexHeatmap(input, output, session, ht)
    })
}

shinyApp(ui = ui, server = server)
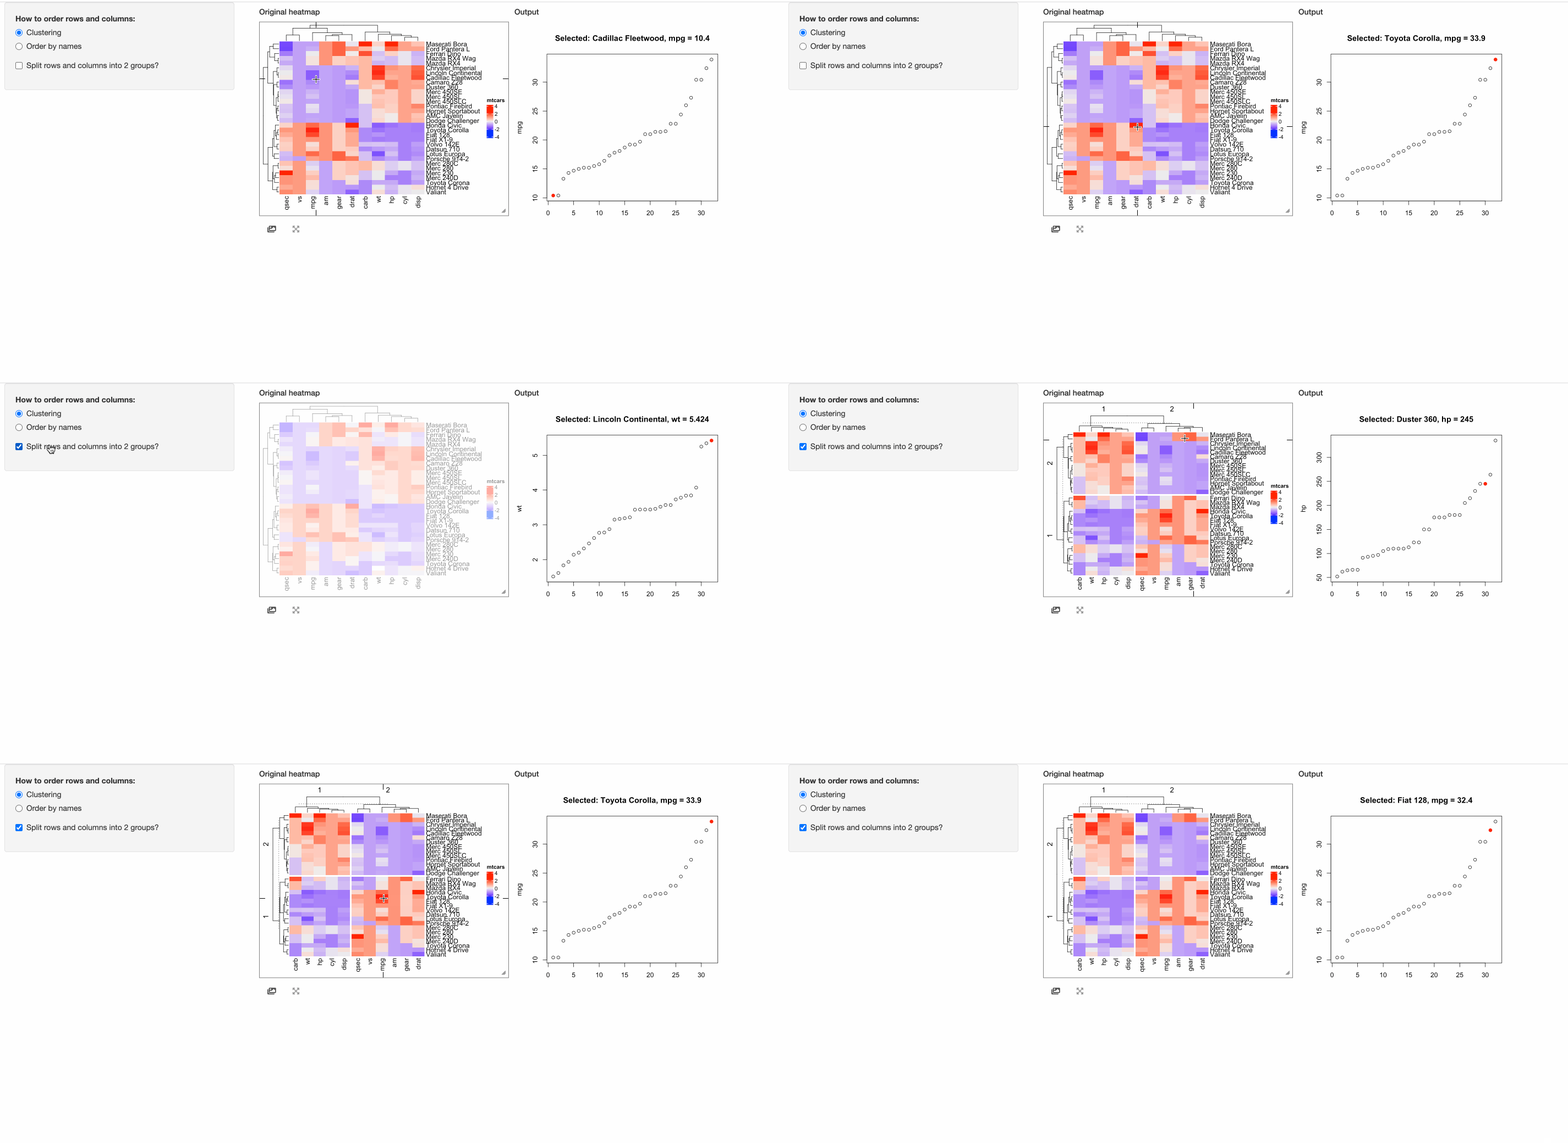
The response of the click event can be self-defined.
Note, the matrix m for heatmap visualization is column-scaled on the original mtcars.
In the next example, when a cell is click, the response will include a point chart of the distribution
of the corresponding column in mtcars.
ui = fluidPage(
    sidebarLayout(
        sidebarPanel(
            radioButtons("order_method", "How to order rows and columns:",
                c("Clustering" = "clustering", "Order by names" = "by_name"),
                selected = "clustering"),
            checkboxInput('split', "Split rows and columns into 2 groups?", FALSE),
            width = 3
        ),
        mainPanel(
            InteractiveComplexHeatmapOutput(response = "click",
                output_ui = plotOutput("plot", width = 400, height = 400)),  # <- this line is changed
        ),
    )
)

# This function defines the response of the click event
click_action = function(df, output) {
    output$plot = renderPlot({
        if(is.null(df)) {
            grid.text("You should click on heatmap cells.")
        } else {
            i = df$row_index
            j = df$column_index
            od = order(mtcars[, j], rownames(mtcars))
            plot(1:nrow(mtcars), mtcars[od, j], xlab = "", ylab = colnames(mtcars)[j],
                main = paste0("Selected: ", rownames(mtcars)[i], ", ", colnames(mtcars)[j], " = ", mtcars[i, j]))
            map = structure(1:32, names = od)
            points(map[as.character(i)], mtcars[i, j], pch = 16, col = "red", cex = 1.2)
        }
    })
}

server = function(input, output, session) {
    observe({
        cluster_rows = FALSE
        cluster_columns = FALSE
        row_order = NULL
        column_order = NULL
        row_km = NULL
        column_km = NULL

        if(input$order_method == "clustering") {
            cluster_rows = TRUE
            cluster_columns = TRUE
        } else {
            row_order = order(rownames(m))
            column_order = order(colnames(m))
        }

        if(input$split) {
            row_km = 2
            column_km = 2
        }

        ht = Heatmap(m, name = "mtcars",
            cluster_rows = cluster_rows, cluster_columns = cluster_columns,
            row_order = row_order, column_order = column_order,
            row_km = row_km, column_km = column_km)
        makeInteractiveComplexHeatmap(input, output, session, ht,
            click_action = click_action)    # <- this line is changed
    })
}

shinyApp(ui = ui, server = server)
Session info
sessionInfo()## R version 4.1.2 (2021-11-01)
## Platform: x86_64-apple-darwin17.0 (64-bit)
## Running under: macOS Big Sur 10.16
##
## Matrix products: default
## BLAS: /Library/Frameworks/R.framework/Versions/4.1/Resources/lib/libRblas.0.dylib
## LAPACK: /Library/Frameworks/R.framework/Versions/4.1/Resources/lib/libRlapack.dylib
##
## locale:
## [1] C/UTF-8/C/C/C/C
##
## attached base packages:
## [1] stats graphics grDevices utils datasets methods base
##
## other attached packages:
## [1] knitr_1.37
##
## loaded via a namespace (and not attached):
## [1] bookdown_0.24 digest_0.6.29 R6_2.5.1 jsonlite_1.7.2
## [5] magrittr_2.0.1 evaluate_0.14 blogdown_0.19 stringi_1.7.6
## [9] rlang_0.4.12 jquerylib_0.1.4 bslib_0.3.1 rmarkdown_2.11
## [13] tools_4.1.2 stringr_1.4.0 xfun_0.29 yaml_2.2.1
## [17] fastmap_1.1.0 compiler_4.1.2 htmltools_0.5.2 sass_0.4.0