Assume we have a huge matrix with 1000 rows. First the circular heatmap:
set.seed(123)
m = matrix(rnorm(1000*10), nrow = 1000)

library(circlize)
circos.heatmap(m, col = colorRamp2(c(-2, 0, 2), c("blue", "white", "red")))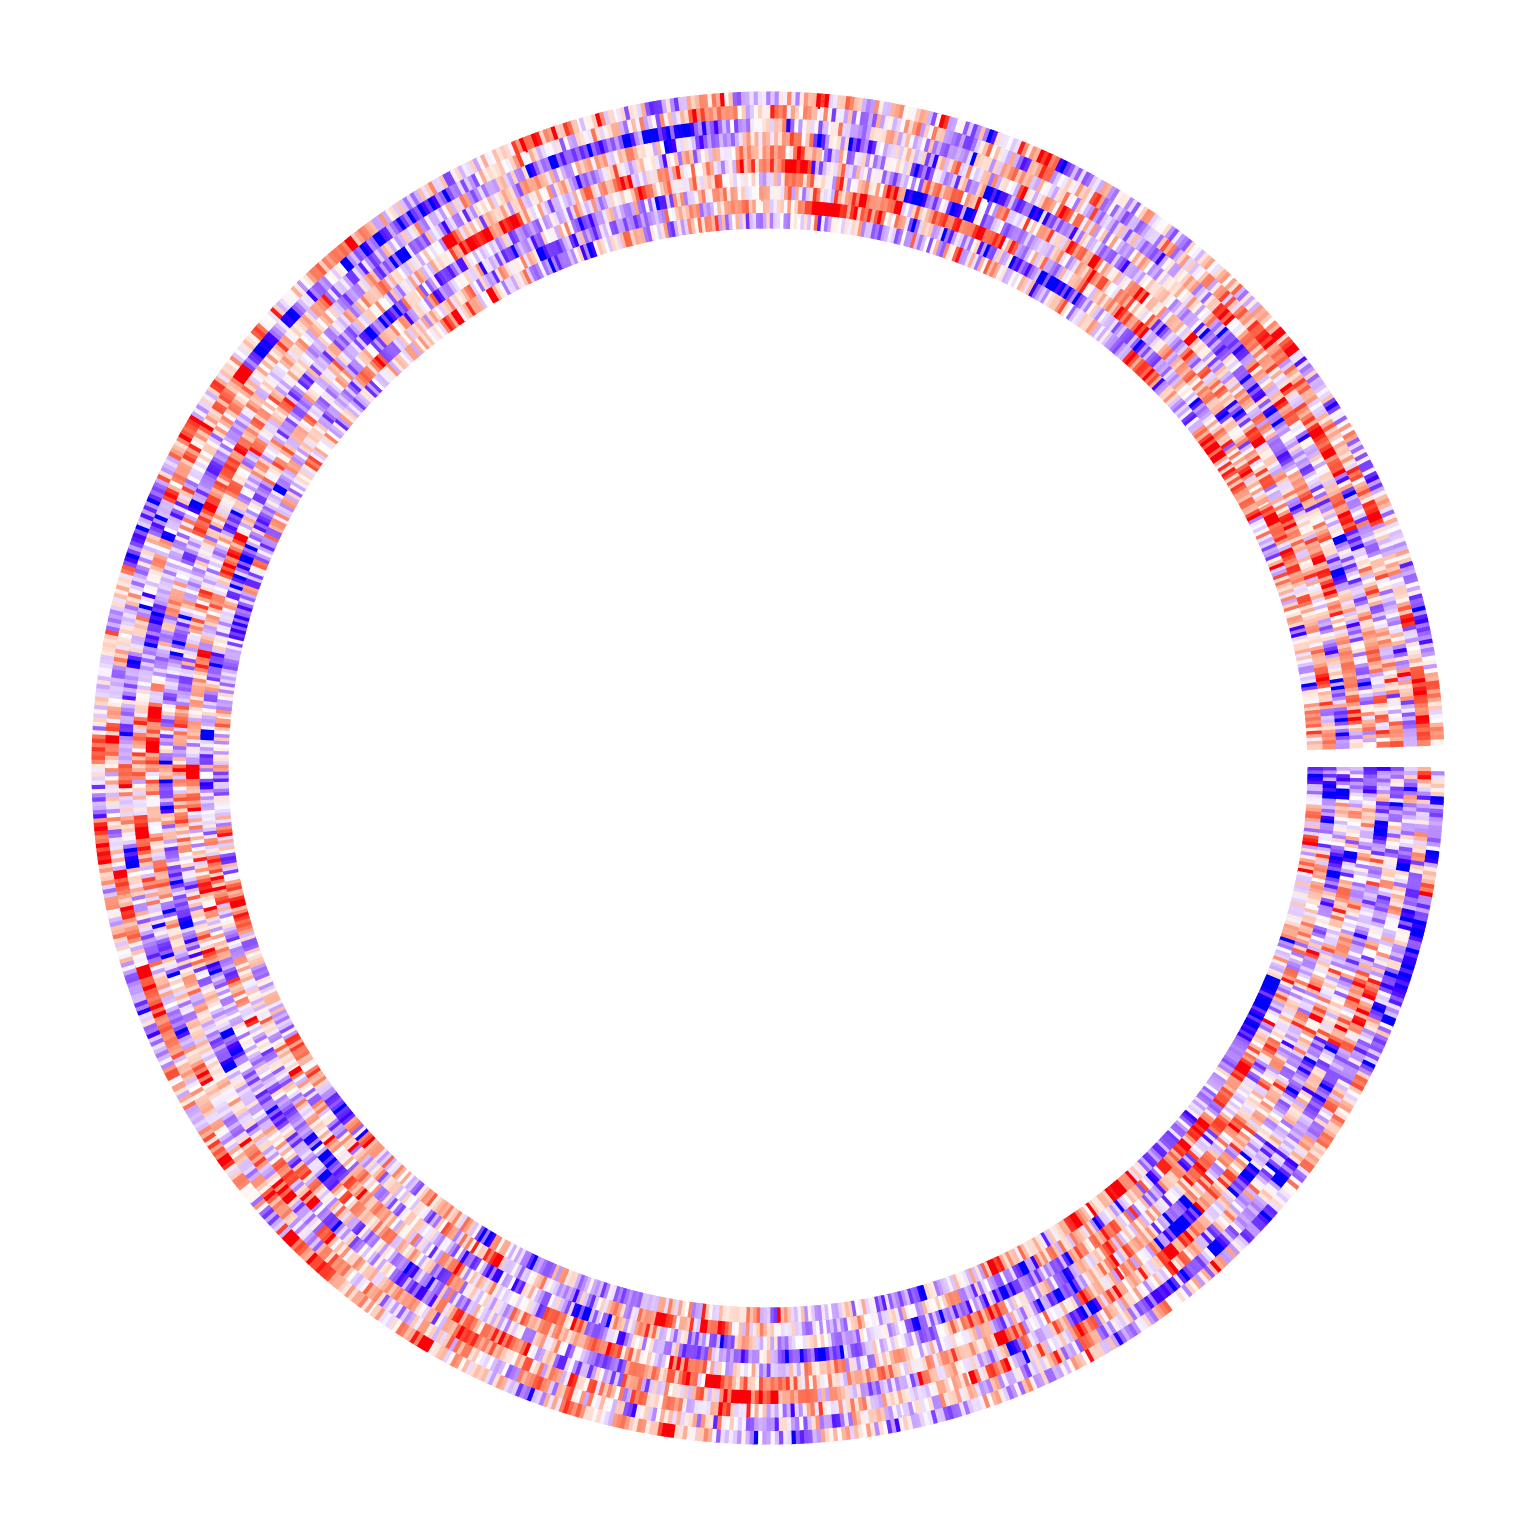
It is basically impossible to add labels for all 1000 rows. Normally what we do is to only add labels for a small amount of rows. E.g., in the following example, we randomly select 50 rows.
row_ind = sample(1000, 50)To correctly add these 50 labels to the circular heatmap, the key thing is to find the positions of these rows on
heatmap. Since clustering and splitting can be applied there, from circlize version 0.4.16, I
added a new function circos.heatmap.get.x() which automatically calculates the x-position of matrix rows.
pos = circos.heatmap.get.x(row_ind)
head(pos)
## sector x row_ind
## 1 group 6.5 443
## 2 group 40.5 351
## 3 group 41.5 779
## 4 group 86.5 280
## 5 group 105.5 690
## 6 group 113.5 326With pos, we can now use circos.labels() to associate labels to the heatmap.
Before adding the labels track, we additionally add a second one-row heatmap track which shows the rows that are selected,
just for making sure the positions calculated by circos.heatmap.get.x() are correct.
anno = rep("no", 1000)
anno[row_ind] = "yes"
circos.heatmap(anno, col = c("no" = "white", "yes" = "purple"), track.height = 0.01)

circos.labels(pos$sector, pos$x, labels = paste0("label_", 1:50))
circos.clear()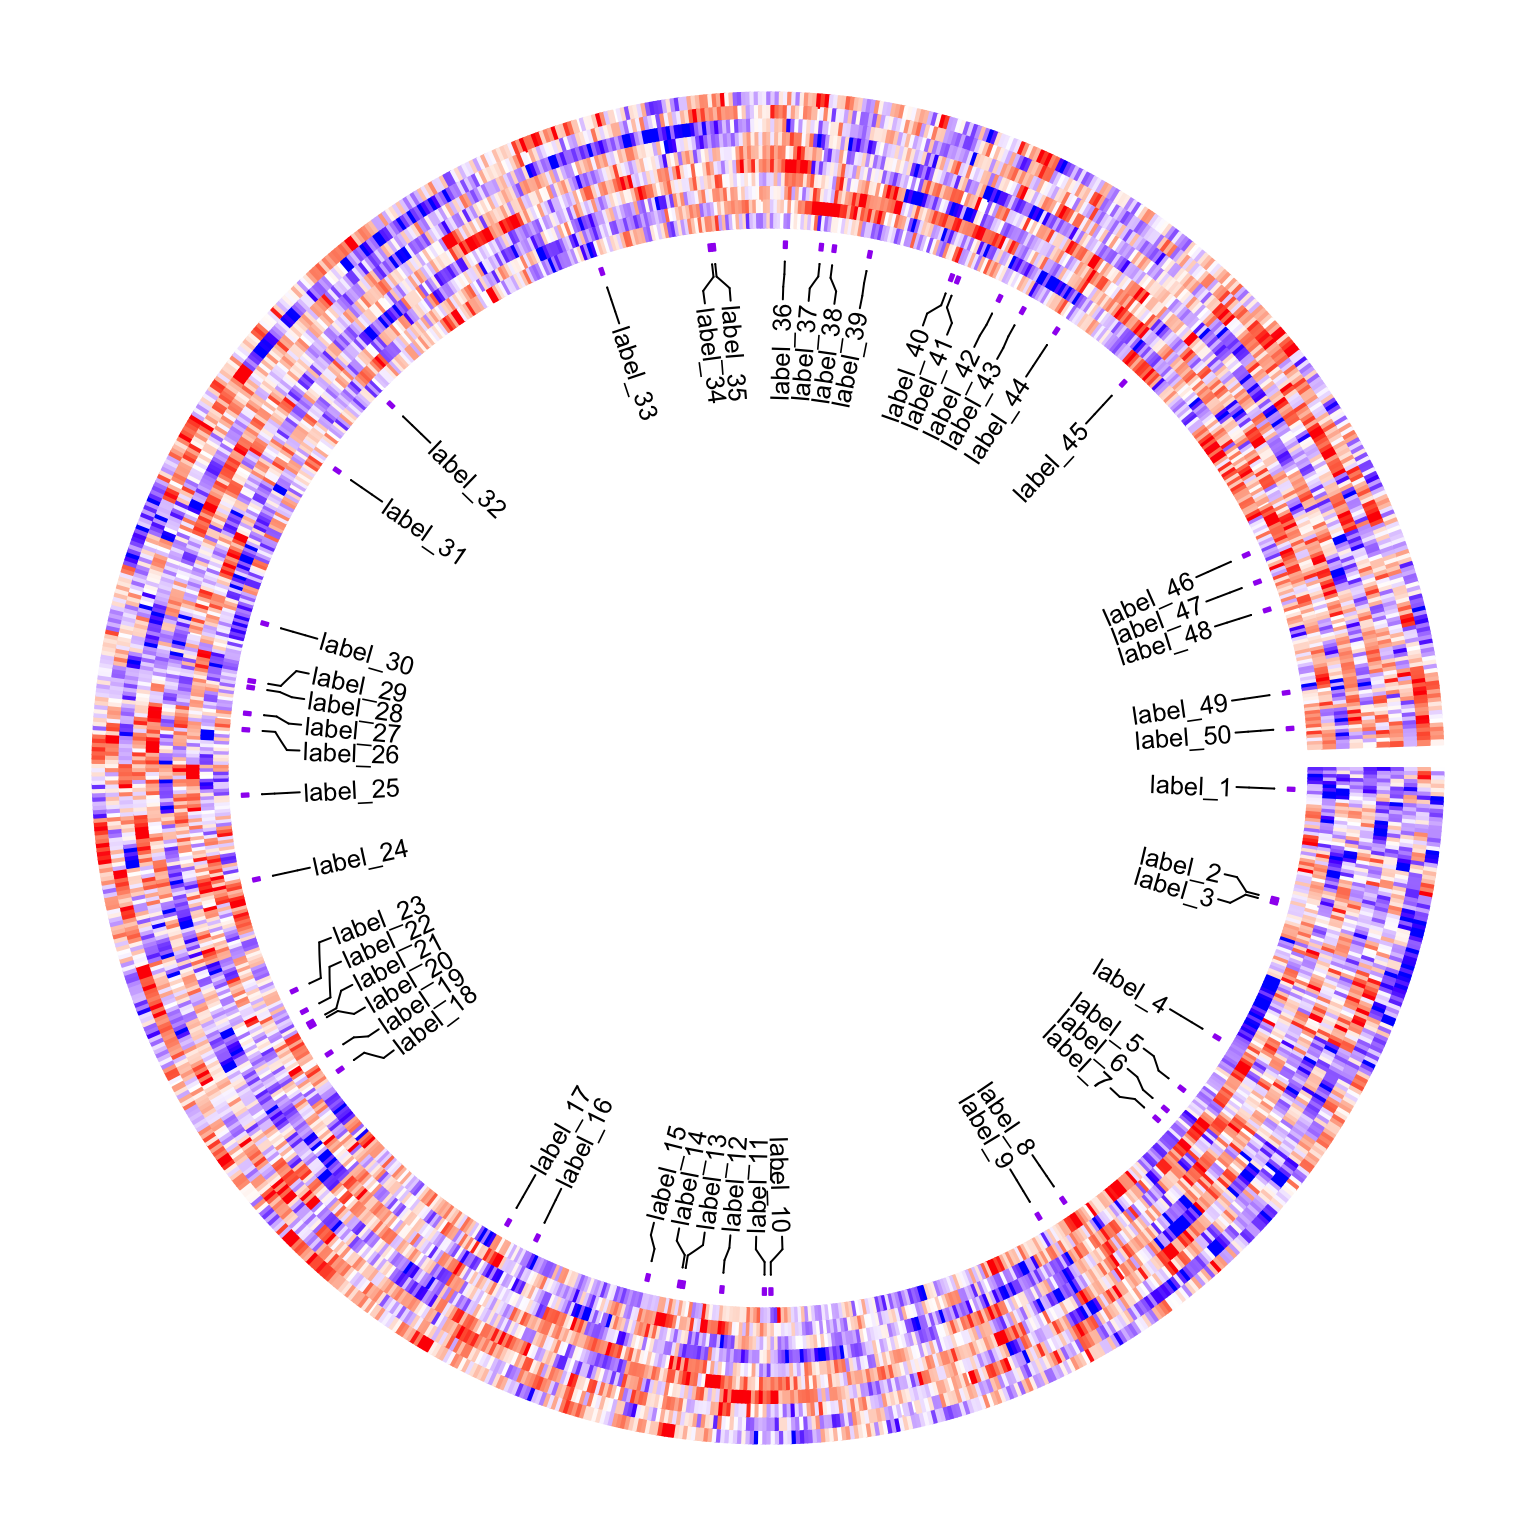
It also works fine when splitting is applied:
split = sample(letters[1:4], 1000, replace = TRUE)
circos.heatmap(m, col = colorRamp2(c(-2, 0, 2), c("blue", "white", "red")),
    split = split)
pos = circos.heatmap.get.x(row_ind)
circos.heatmap(anno, col = c("no" = "white", "yes" = "purple"), track.height = 0.01)
circos.labels(pos$sector, pos$x, labels = paste0("label_", 1:50))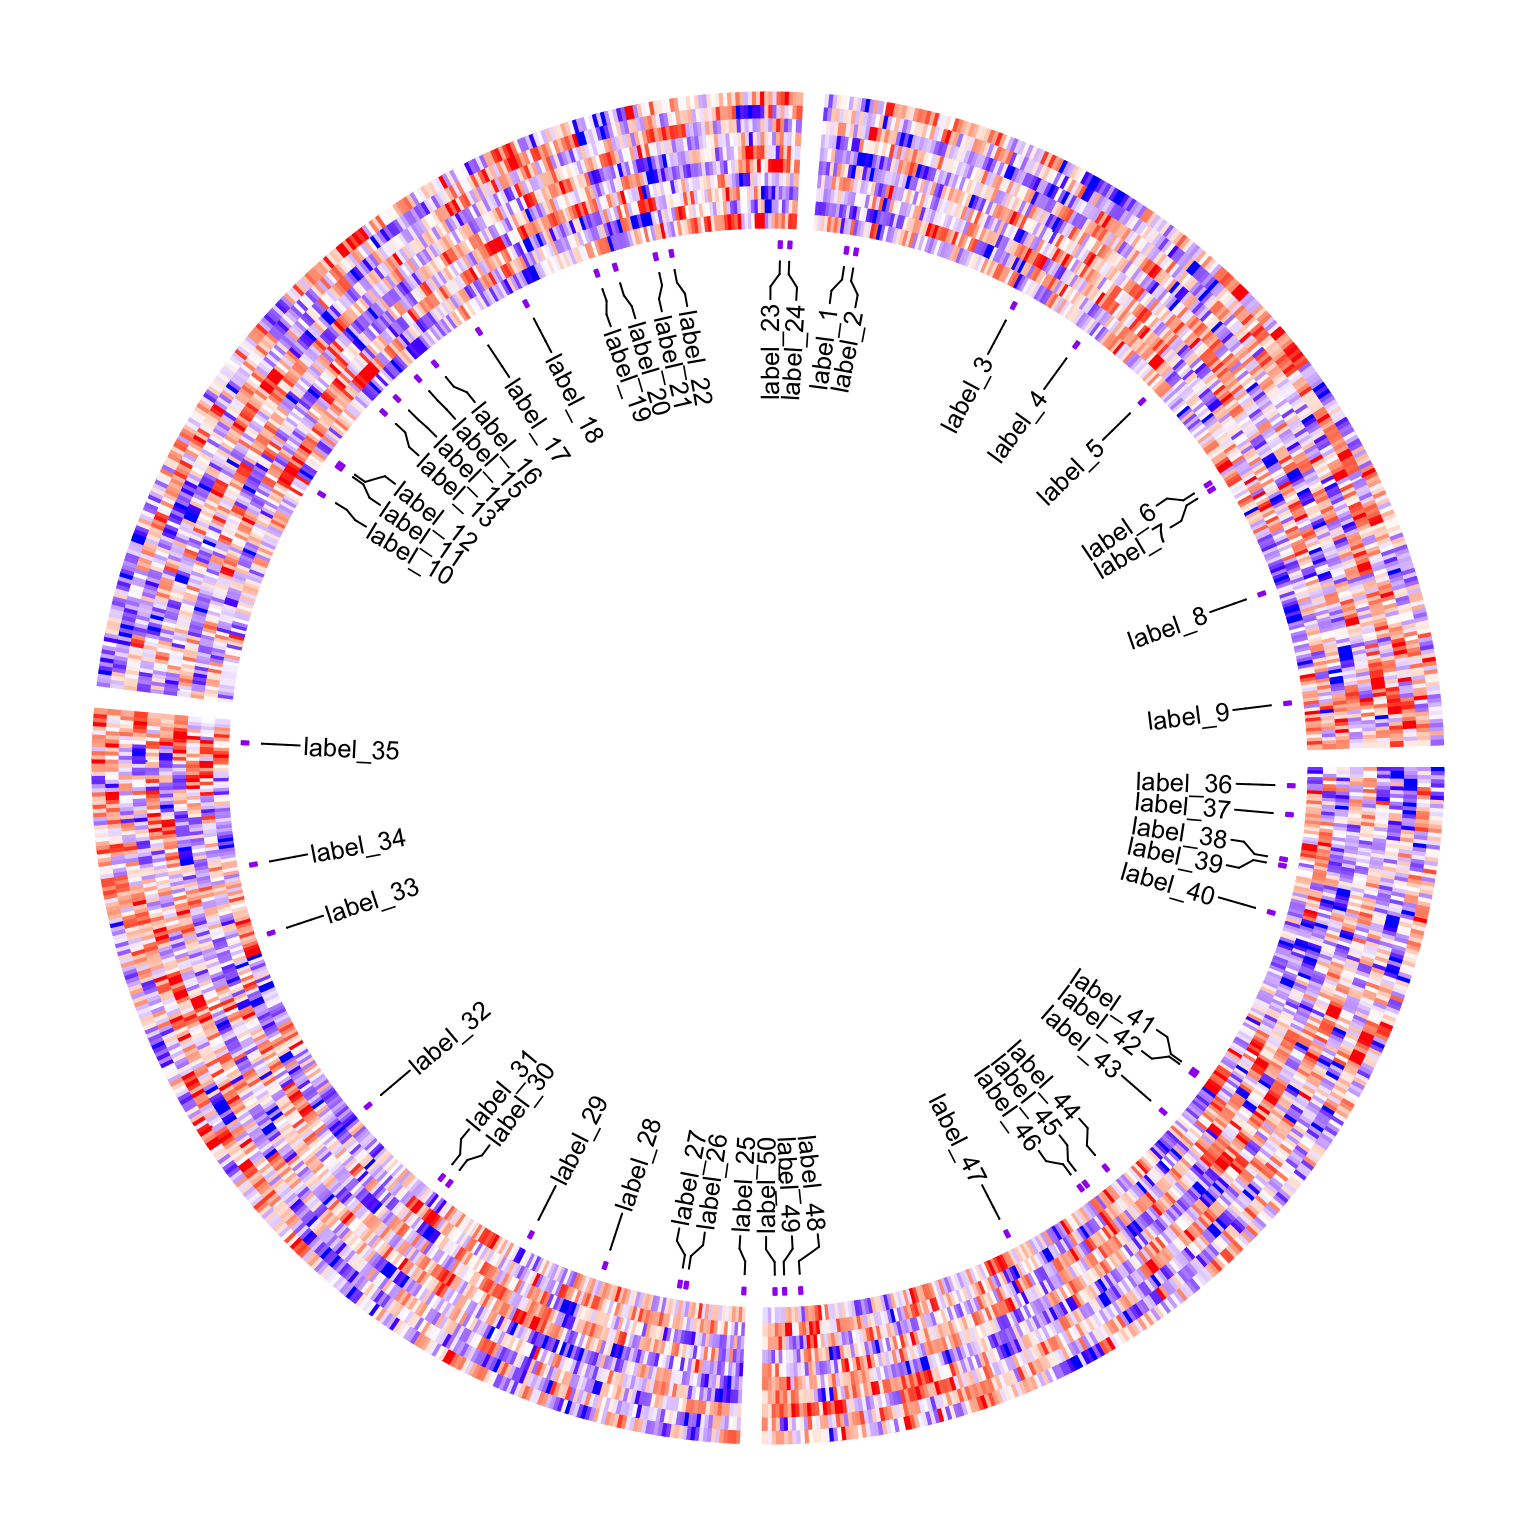
circos.clear()