ComplexHeatmap can make a list of heatmap where rows or columns in different heatmaps can be easily
corresponded. However, in some scenarios, users may only want to combine multiple plots into one single and large plot,
where each plot is like a figure panel. Normally we use cowplot or patchwork package, or even manually with
pushViewport()/viewport() functions to combine multiple figure panels, but for heatmaps, users may additionally
want all heatmaps are aligned by the heatmap bodies, while not by the whole heatmap plot.
To illustrate the problem, I first create two heatmaps where one contains 20 rows/5 columns, and the second heatmap contains 30 rows/4 columns. Also they have different widths for row dendrograms, and they have different row names.
library(ComplexHeatmap)
m1 = matrix(rnorm(20*5), nrow = 5)
rownames(m1) = letters[1:5]
ht1 = Heatmap(m1, col = c("blue", "white", "red"),
    column_km = 2, show_column_dend = FALSE,
    show_heatmap_legend = FALSE, row_dend_width = unit(1, "cm"),
    column_title = "This is heatmap 1")

m2 = matrix(rnorm(30*4), nrow = 4)
rownames(m2) = month.name[1:4]
ht2 = Heatmap(m2, col = c("blue", "black", "yellow"),
    column_km = 3, show_column_dend = FALSE,
    show_heatmap_legend = FALSE, row_dend_width = unit(3, "cm"),
    column_title = "This is heatmap 2")
Next we use cowplot package to vertically combine the two heatmaps:
p1 = grid.grabExpr(draw(ht1))
p2 = grid.grabExpr(draw(ht2))
library(cowplot)
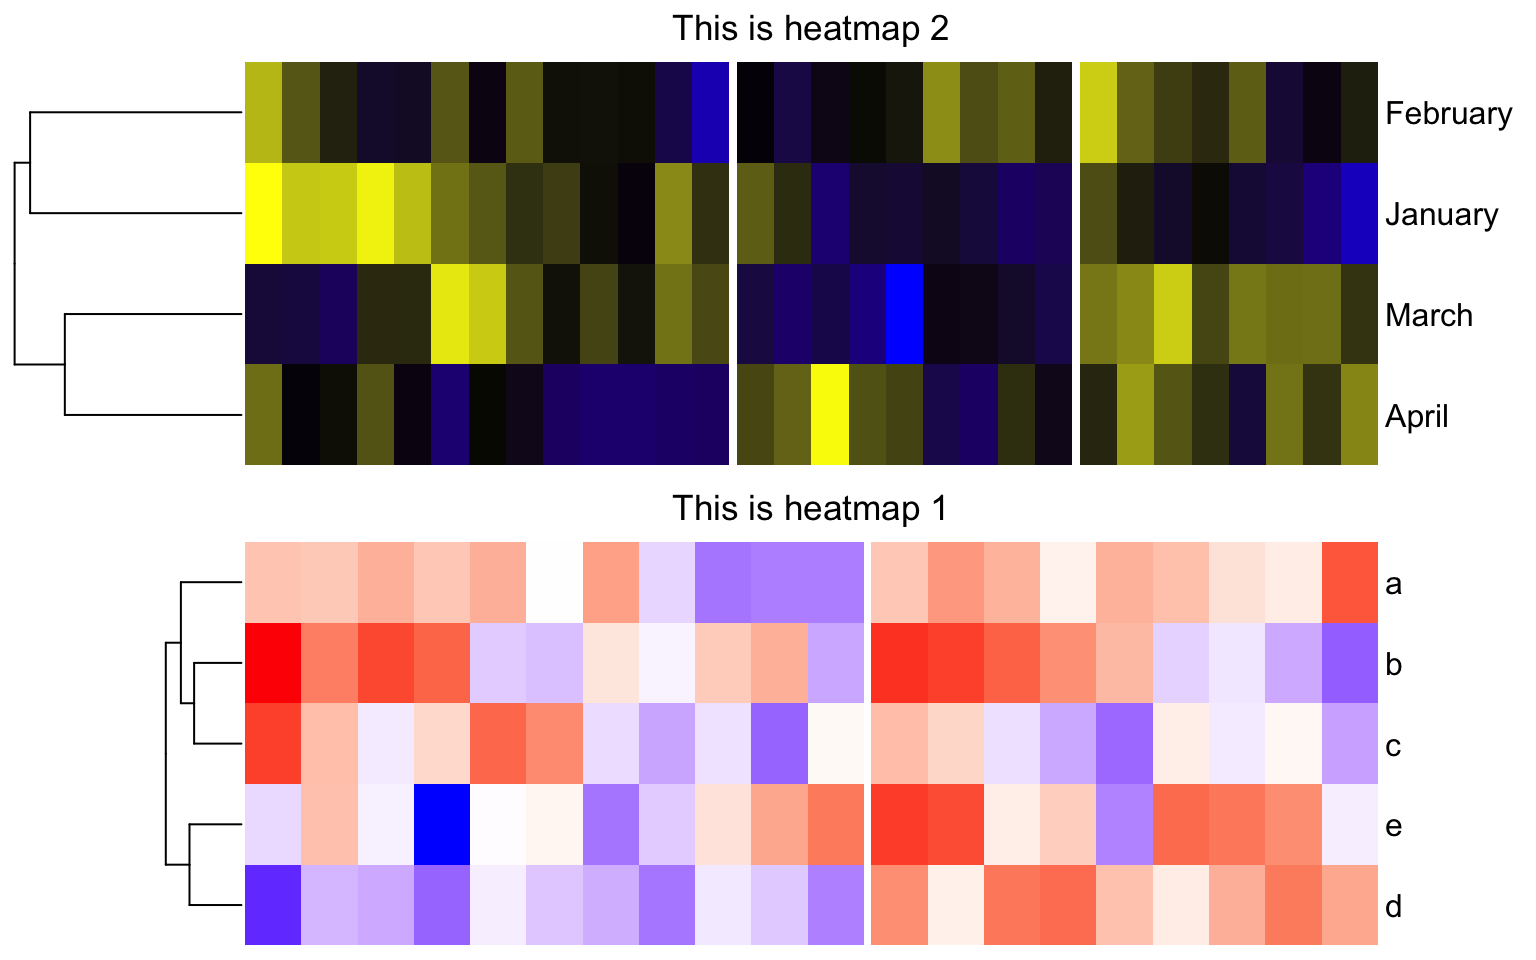
plot_grid(p1, p2, nrow = 2)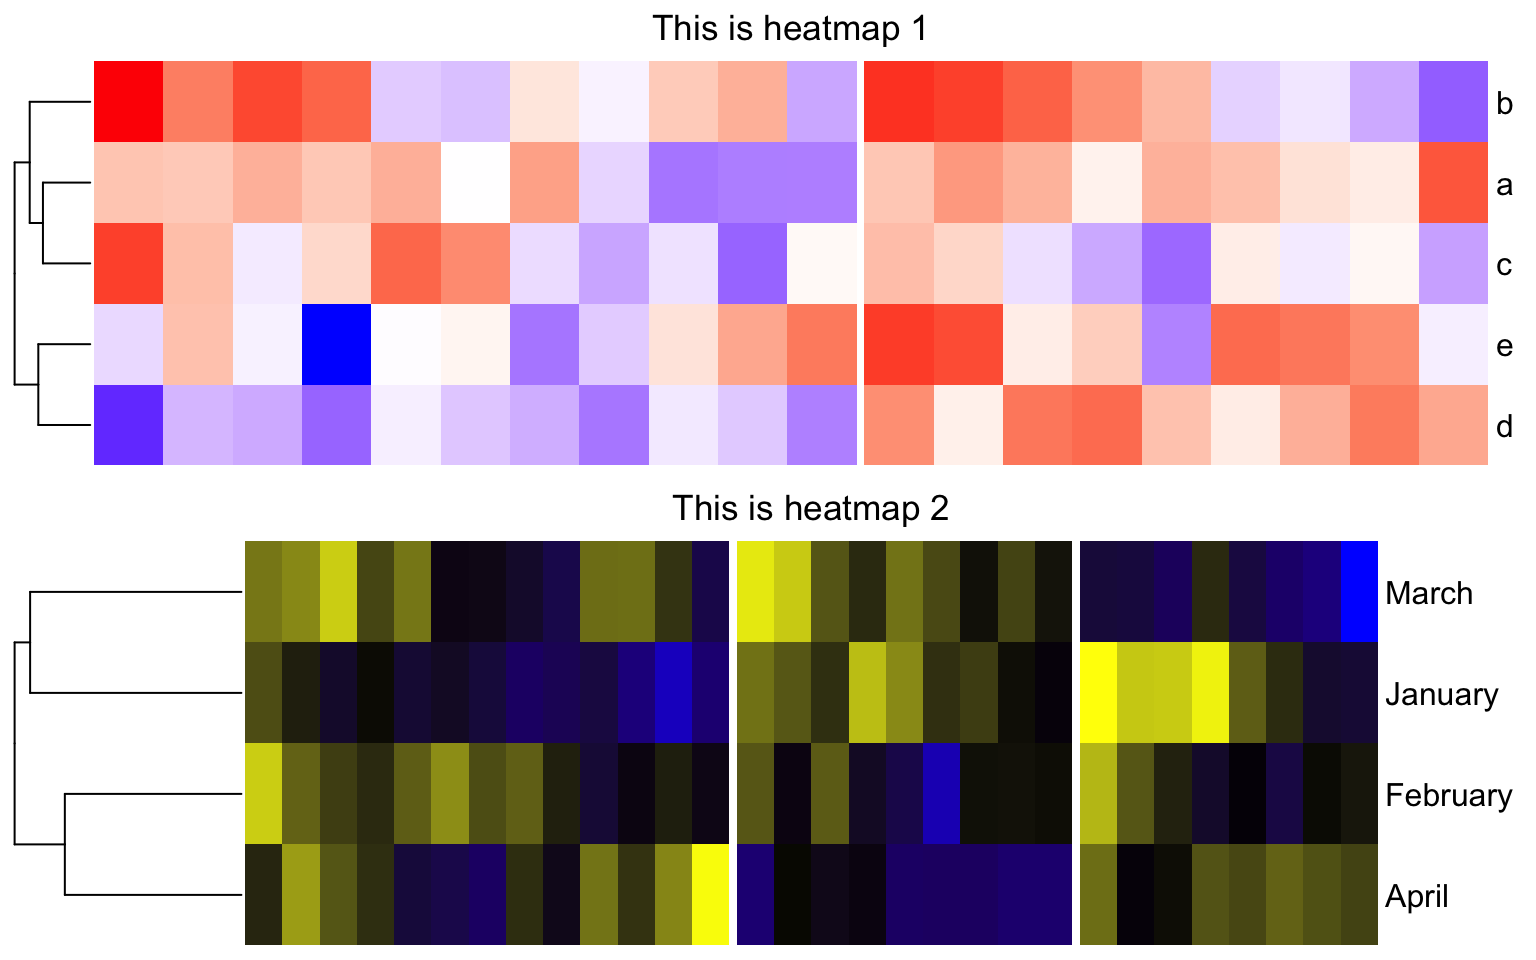
As can be seen in the plot above, due to the different numbers of columns, different dendrogram widths and different widths for row names, the two heatmaps are not aligned by the heatmap bodies, which makes the plot looking ugly.
To perfectly align heatmaps by their bodies, the key thing is to calculate the total width of all its left heatmap components and the total width of all its right heatmap components. This is a two-step process.
First we need to process the heatmap object by the function prepare(). prepare() is normally internally used, which initializes
the layout of the heatmap and calculates the size of each heatmap component.
ht1 = prepare(ht1)
ht2 = prepare(ht2)
Second, we can use component_width() to obtain the widths of heatmap components. In a heatmap, horizontally, there are nine heatmap
componets, which are left title, left dendrogram, left row lables, left annotation, heatmap body, right annotation, right row labels,
right dendrogram and right title.
The following code calculates the total width of the componets on the left, and on the right of the heatmap body.
left1 = sum(component_width(ht1, 1:4))
left2 = sum(component_width(ht2, 1:4))
max_left = max(left1, left2)

right1 = sum(component_width(ht1, 6:9))
right2 = sum(component_width(ht2, 6:9))
max_right = max(right1, right2)
With max_left and max_right, we can calculate a proper offset and size for each heatmap, and align heatmaps perfectly by the
heamtap bodies.
Similar as before, the heatmaps are captured as grid objects:
p1 = grid.grabExpr(draw(ht1))
p2 = grid.grabExpr(draw(ht2))
In the last chunk of code, we manually create viewports and put heatmaps in. Note
for each heatmap, we calculate offset_left and offset_right based on max_left and max_right,
then we can set a proper offset and width for each heatmap.
grid.newpage()

pushViewport(viewport(y = 0, height = unit(0.5, "npc"), just = "bottom"))
offset_left = max_left - left1
offset_right = max_right - right1
pushViewport(viewport(x = offset_left, width = unit(1, "npc") - offset_left - offset_right, just = "left"))
grid.draw(p1)
popViewport()
popViewport()

pushViewport(viewport(y = 0.5, height = unit(0.5, "npc"), just = "bottom"))
offset_left = max_left - left2
offset_right = max_right - right2
pushViewport(viewport(x = offset_left, width = unit(1, "npc") - offset_left - offset_right, just = "left"))
grid.draw(p2)
popViewport()
popViewport()