The question: for the following heatmap with a top barplot annotation, how to make it to a ggplot2-style plot, i.e., with background grid lines?
library(ComplexHeatmap)

set.seed(666)
m = matrix(rnorm(100), 10)
x = abs(rnorm(10))

Heatmap(m, top_annotation = HeatmapAnnotation(foo = anno_barplot(x), height = unit(8, "cm")))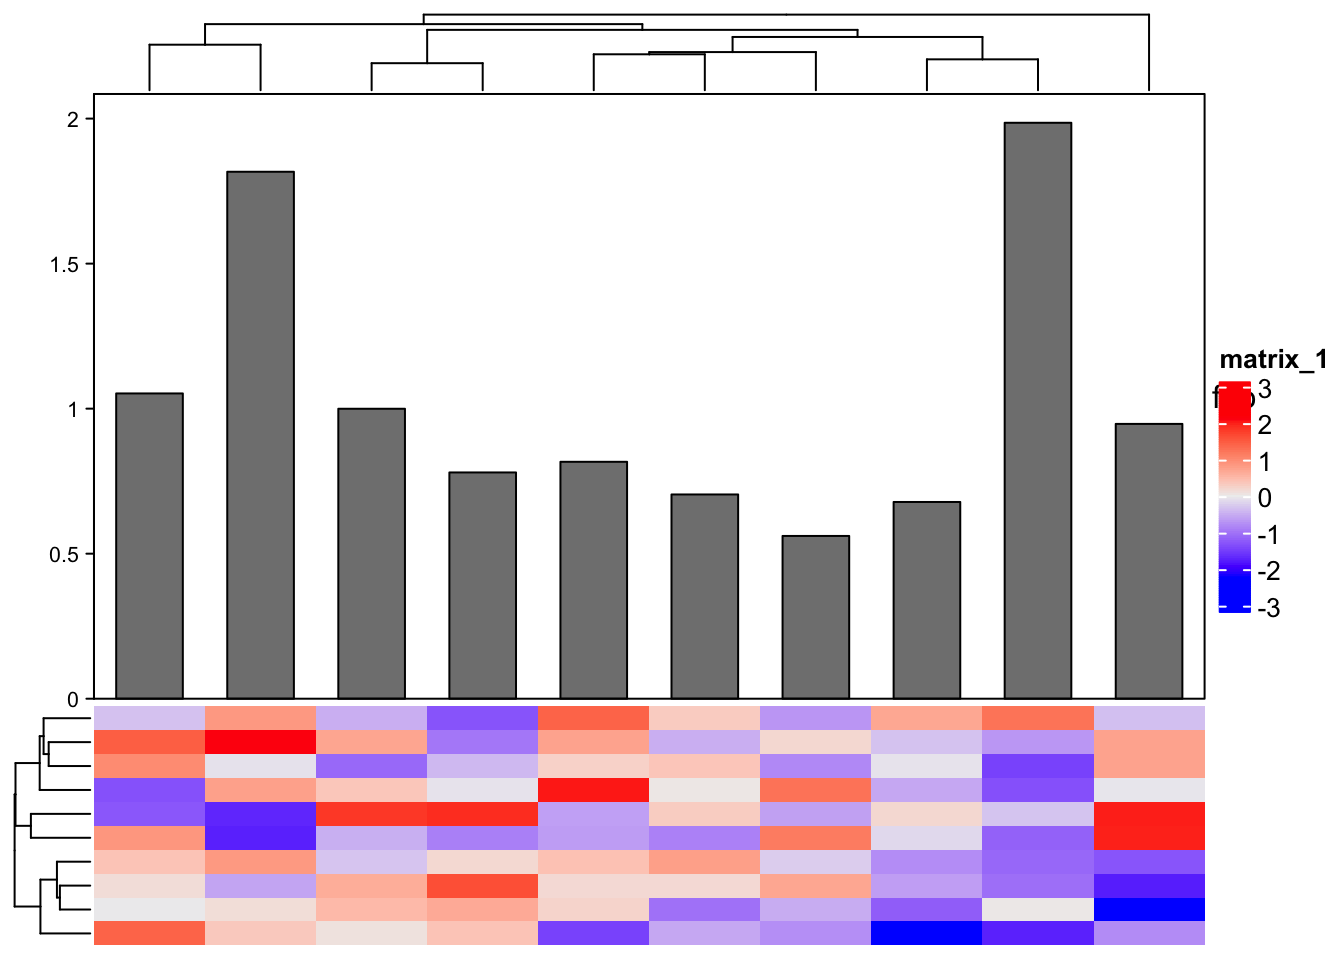
One natural solution is to use the decorate_annotation() function to add such
additional graphics to the “foo” annotation. Just note
decorate_annotation() is a post-processing function where the grey background will
overwrite the bars in the annotation. Thus, we need to redraw the bars after
the background grid lines are drawn.
Also note, when there is column reordering, we need to capture the new order. This information will be used for redrawing the bars.
ht = Heatmap(m, top_annotation = HeatmapAnnotation(foo = anno_barplot(x), height = unit(8, "cm")))
ht = draw(ht)
column_order = column_order(ht)

decorate_annotation("foo", {
    grid.rect(gp = gpar(fill = "#DDDDDD"))

    # x-breaks are always located on 1:nc where `nc` is the number of columns
    x_breaks = unit(1:10, "native")
    nx = length(x_breaks)

    # y-breaks are read from the plot
    y_breaks = unit(c(0, 0.5, 1, 1.5, 2), "native")
    ny = length(y_breaks)

    grid.segments(x_breaks, rep(unit(0, "npc"), nx), x_breaks, rep(unit(1, "npc"), nx), gp = gpar(col = "white"))
    grid.segments(rep(unit(0, "npc"), nx), y_breaks, rep(unit(1, "npc"), nx), y_breaks, gp = gpar(col = "white"))

    # draw the bars again. Note `x` should be reordered to match the matrix columns
    grid.rect(x_breaks, unit(0, "npc"), width = unit(0.6, "native"), height = unit(x[column_order], "native"),
        just = "bottom", gp = gpar(fill = "#808080", col = "black"))

    # last step is to draw the global frame of the annotation region
    grid.rect(gp = gpar(fill = NA))
})
In the previous code, we already know the values of x-breaks and y-breaks, which can be read from the plot and inferred from the number of columns of the matrix. Now the next question is, how to make it general where the x-breaks and y-breaks can be automatically inferred from the original matrix?
Observe the heatmap, we can see the y-breaks are the y-coordinates of the ticks or labels on the y-axis. If we can obtain these grob objects, we can obtain the coordinates of y-breaks. Similarly, the x-breaks are the x-coordinates of bars. If we can obtain such rect grobs, we can also obtain the coordinates of x-breaks.
Next let’s see whether we can obtain the axis tick grob and the bar (rect) grob from the heatmap.
These two grobs are in the viewport of the “foo” annotation. The grob object can be obtained by
the grid.get() function by providing the name of the grob. Now the problem becomes how to
obtain the names of the axis grob and the rect grob within the “foo” annotation viewport?
We use the grid.ls() function which lists all viewports and grobs on the display list.
grid.ls() returns a list of full viewport paths (vpPath), grob paths (gPath) if the grob is a complex one,
and the name of the low-level grobs (name). We use vpPath to match the “foo” annotation viewport,
use gPath to match the y-axis (in ComplexHeatmap, the axis is implemented by a annotation_axis complex grob),
and use name to match the segments of y-axis.
Heatmap(m, top_annotation = HeatmapAnnotation(foo = anno_barplot(x), height = unit(8, "cm")))# grid.ls() returns a lists of all viewports and grobs, from the ROOT (the global) level
global_gl = grid.ls(viewport = TRUE, print = FALSE)
str(global_gl)## List of 6
## $ name : chr [1:77] "ROOT" "global" "GRID.rect.235" "global_layout" ...
## $ gDepth : num [1:77] 0 0 0 0 0 0 0 0 0 0 ...
## $ vpDepth: num [1:77] 0 1 2 2 3 4 5 6 7 8 ...
## $ gPath : chr [1:77] "" "" "" "" ...
## $ vpPath : chr [1:77] "" "ROOT" "ROOT::global" "ROOT::global" ...
## $ type : chr [1:77] "vpListing" "vpListing" "grobListing" "vpListing" ...
## - attr(*, "class")= chr "flatGridListing"The following code is put side decorate_annotation(). I first explain the code chunk by chunk.
The code inside decorate_annotation() is applied in the corresponding annotation viewport,
so here current.viewport() returns the “foo” annotation viewport, and vp$name is the name
of the viewport.
vp = current.viewport()Next we match the axis ticks. Note the last line can also be changed to grepl("text", global_gl$name) to
match the axis labels.
i = which(grepl(vp$name, global_gl$vpPath) &
          grepl("annotation_axis", global_gl$gPath) &
          grepl("segments", global_gl$name))
gb_name = unique(global_gl$name[i])
Once we have the name of the axis tick grob, we can retrieve the grob object with grid.get().
gb_tick = grid.get(gb_name)gb_tick is a segmentsGrob object. The y-coordinates are in gb_tick$y0.
y_breaks = gb_tick$y0
ny = length(y_breaks)
Similarly, to match the bar grobs:
i = which(grepl(vp$name, global_gl$vpPath) &
grepl("rect", global_gl$name))
i = i[1] # there might be multiple hits, but the values of grob names are the same
gb_name = unique(global_gl$name[i])
gb_bar = grid.get(gb_name)
x_breaks = gb_bar$x
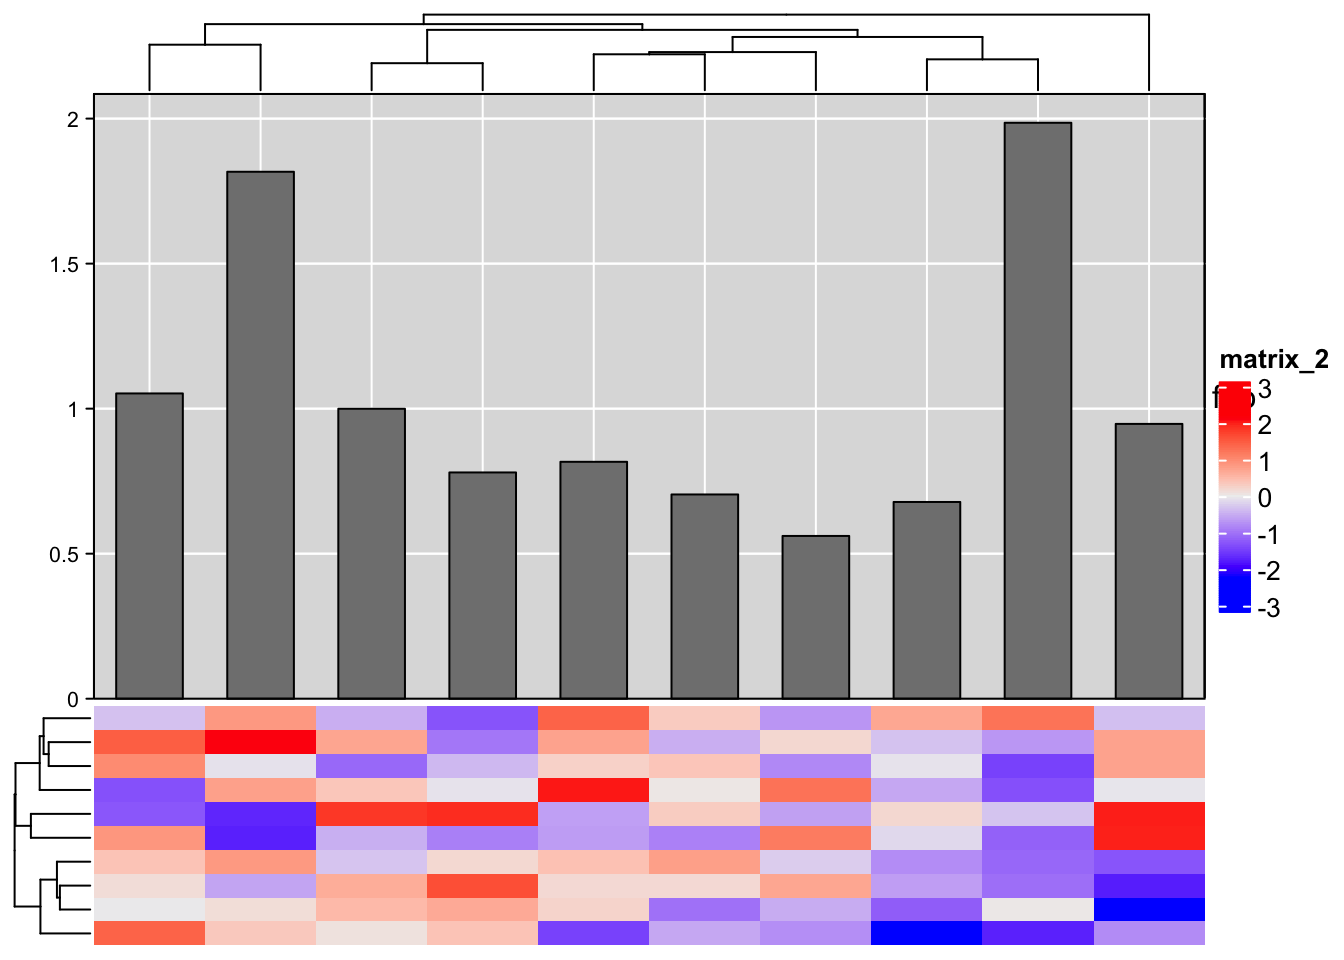
nx = length(x_breaks)Now with the coordinates of x-breaks and y-breaks known, we can draw the background grid lines. We put all these code
inside decorate_annotation().
Note, to redraw the bars, we don’t need the column reordering any more. gb_bar already contains the reordered bars.
Heatmap(m, top_annotation = HeatmapAnnotation(foo = anno_barplot(x), height = unit(8, "cm")))

decorate_annotation("foo", {

    global_gl = grid.ls(viewport = TRUE, print = FALSE)

    vp = current.viewport()

    i = which(grepl(vp$name, global_gl$vpPath) &
              grepl("annotation_axis", global_gl$gPath) &
              grepl("segments", global_gl$name))
    gb_name = unique(global_gl$name[i])
    gb_tick = grid.get(gb_name)
    y_breaks = gb_tick$y0
    ny = length(y_breaks)

    i = which(grepl(vp$name, global_gl$vpPath) &
              grepl("rect", global_gl$name))
    i = i[1]  # there might be multiple hits, but the values of grob names are the same
    gb_name = unique(global_gl$name[i])

    gb_bar = grid.get(gb_name)
    x_breaks = gb_bar$x
    nx = length(x_breaks)

    grid.rect(gp = gpar(fill = "#DDDDDD"))

    # now we have the x-breaks and y-breaks, we can draw the grid lines
    grid.segments(x_breaks, rep(unit(0, "npc"), nx), x_breaks, rep(unit(1, "npc"), nx), gp = gpar(col = "white"))
    grid.segments(rep(unit(0, "npc"), nx), y_breaks, rep(unit(1, "npc"), nx), y_breaks, gp = gpar(col = "white"))

    # draw the bars again
    grid.draw(gb_bar)

    # last step is to draw the global frame of the annotation region
    grid.rect(gp = gpar(fill = NA))
})
Let’s wrap the code into a function and test it:
add_background_to_column_barplot_annotation = function(anno_name) {
decorate_annotation(anno_name, {
global_gl = grid.ls(viewport = TRUE, print = FALSE)
vp = current.viewport()
i = which(grepl(vp$name, global_gl$vpPath) &
grepl("annotation_axis", global_gl$gPath) &
grepl("segments", global_gl$name))
gb_name = unique(global_gl$name[i])
gb_tick = grid.get(gb_name)
y_breaks = gb_tick$y0
ny = length(y_breaks)
i = which(grepl(vp$name, global_gl$vpPath) &
grepl("rect", global_gl$name))
i = i[1] # there might be multiple hits, but the values of grob names are the same
gb_name = unique(global_gl$name[i])
gb_bar = grid.get(gb_name)
x_breaks = gb_bar$x
nx = length(x_breaks)
grid.rect(gp = gpar(fill = "#DDDDDD"))
# now we have the x-breaks and y-breaks, we can draw the grid lines
grid.segments(x_breaks, rep(unit(0, "npc"), nx), x_breaks, rep(unit(1, "npc"), nx), gp = gpar(col = "white"))
grid.segments(rep(unit(0, "npc"), nx), y_breaks, rep(unit(1, "npc"), nx), y_breaks, gp = gpar(col = "white"))
# draw the bars again
grid.draw(gb_bar)
# last step is to draw the global frame of the annotation region
grid.rect(gp = gpar(fill = NA))
})
}
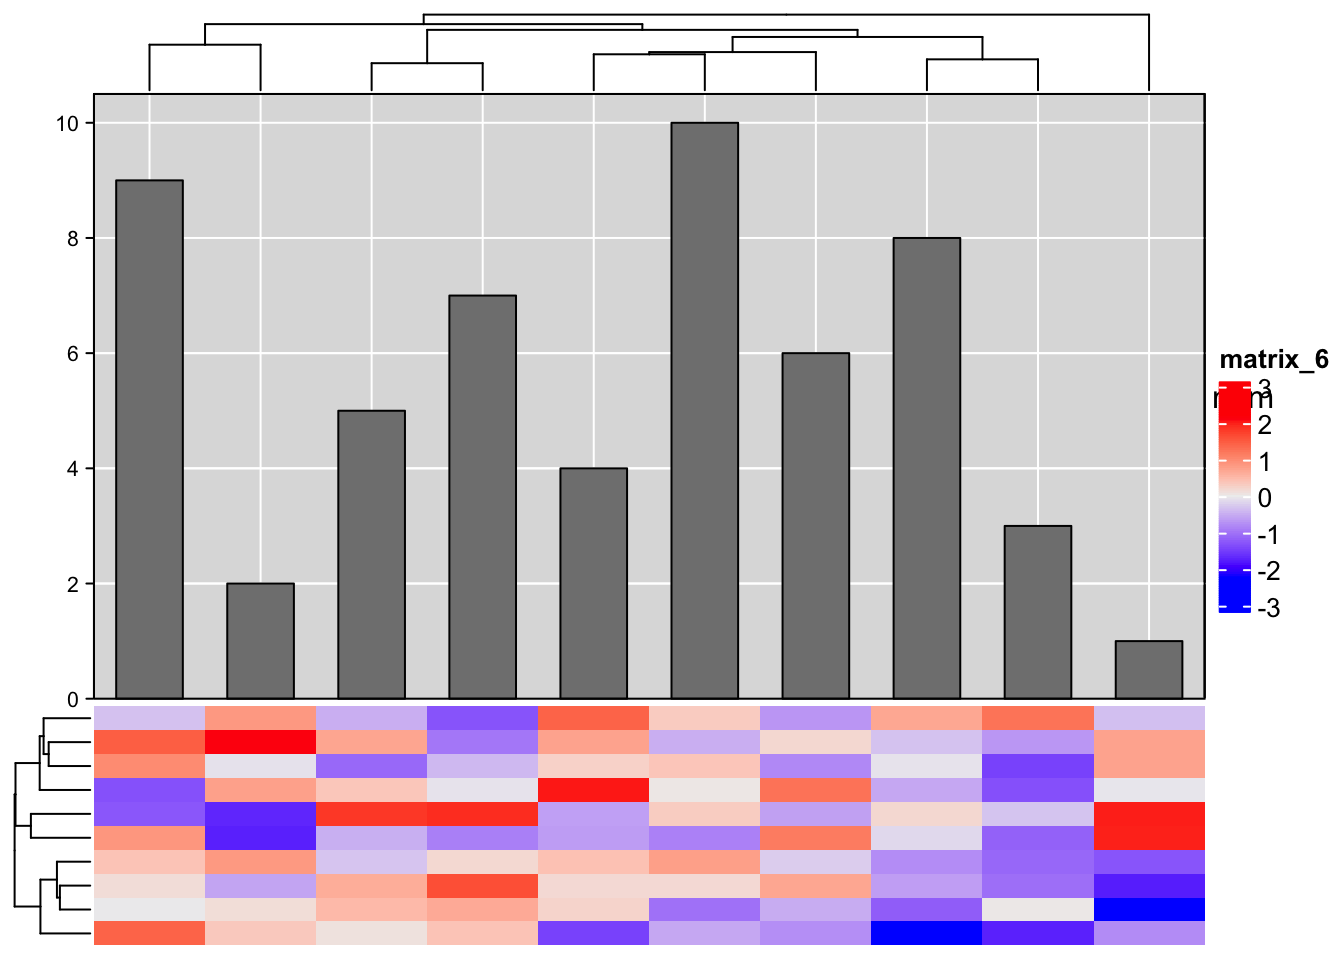
Heatmap(m, top_annotation = HeatmapAnnotation(num = anno_barplot(1:10), height = unit(8, "cm")))
add_background_to_column_barplot_annotation("num")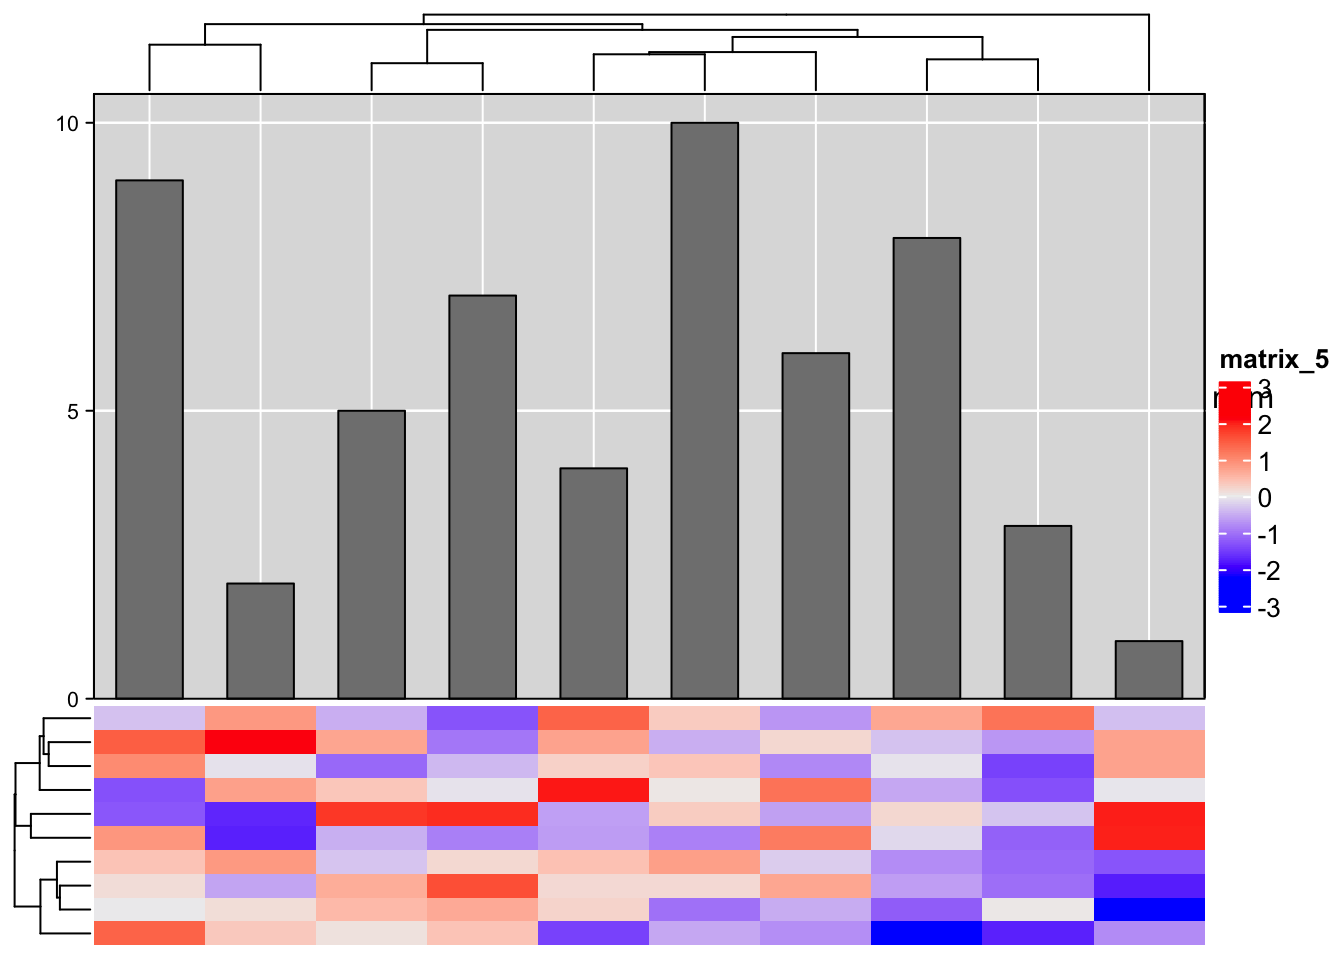
Heatmap(m, top_annotation = HeatmapAnnotation(num = anno_barplot(1:10, axis_param = list(at = seq(0, 10, by = 2))),
                                              height = unit(8, "cm")))
add_background_to_column_barplot_annotation("num")