Draw a BioCarta pathway
grid.biocarta(
  pathway,
  color = NULL,
  x = unit(0.5, "npc"),
  y = unit(0.5, "npc"),
  width = NULL,
  height = NULL,
  just = "centre",
  default.units = "npc",
  name = NULL
)

biocartaGrob(
  pathway,
  color = NULL,
  x = unit(0.5, "npc"),
  y = unit(0.5, "npc"),
  width = NULL,
  height = NULL,
  just = "centre",
  default.units = "npc",
  name = NULL
)
Arguments
- pathway
A BioCarta pathway ID, a MSigDB ID or a
biocarta_pathwayobject. All valid BioCarta pathway IDs are inall_pathways(). The list of MSigDB IDs for BioCarta pathways can be found at https://www.gsea-msigdb.org/gsea/msigdb/human/genesets.jsp?collection=CP:BIOCARTA.- color
A named vector where names should correspond to Entrez IDs.
- x
A numeric vector or unit object specifying x-location.
- y
A numeric vector or unit object specifying y-location.
- width
A numeric vector or unit object specifying width.
- height
A numeric vector or unit object specifying width.
- just
The same as in
grid::viewport().- default.units
The same as in
grid::viewport().- name
The same as in
grid::viewport().
Value
biocartaGrob() returns a gTree object.
Details
The graphics object contains a pathway image and genes highlighted on the image.
The aspect ratio of the image is kept. If one of width and height is set, the
other dimension is calculated by the aspect ratio. If both of width and height
is set or inherit from parent viewport, the width and height are automatically adjust
to let one dimension completely fill the viewport.
Examples
library(grid)
grid.newpage()
grid.biocarta("h_RELAPathway")
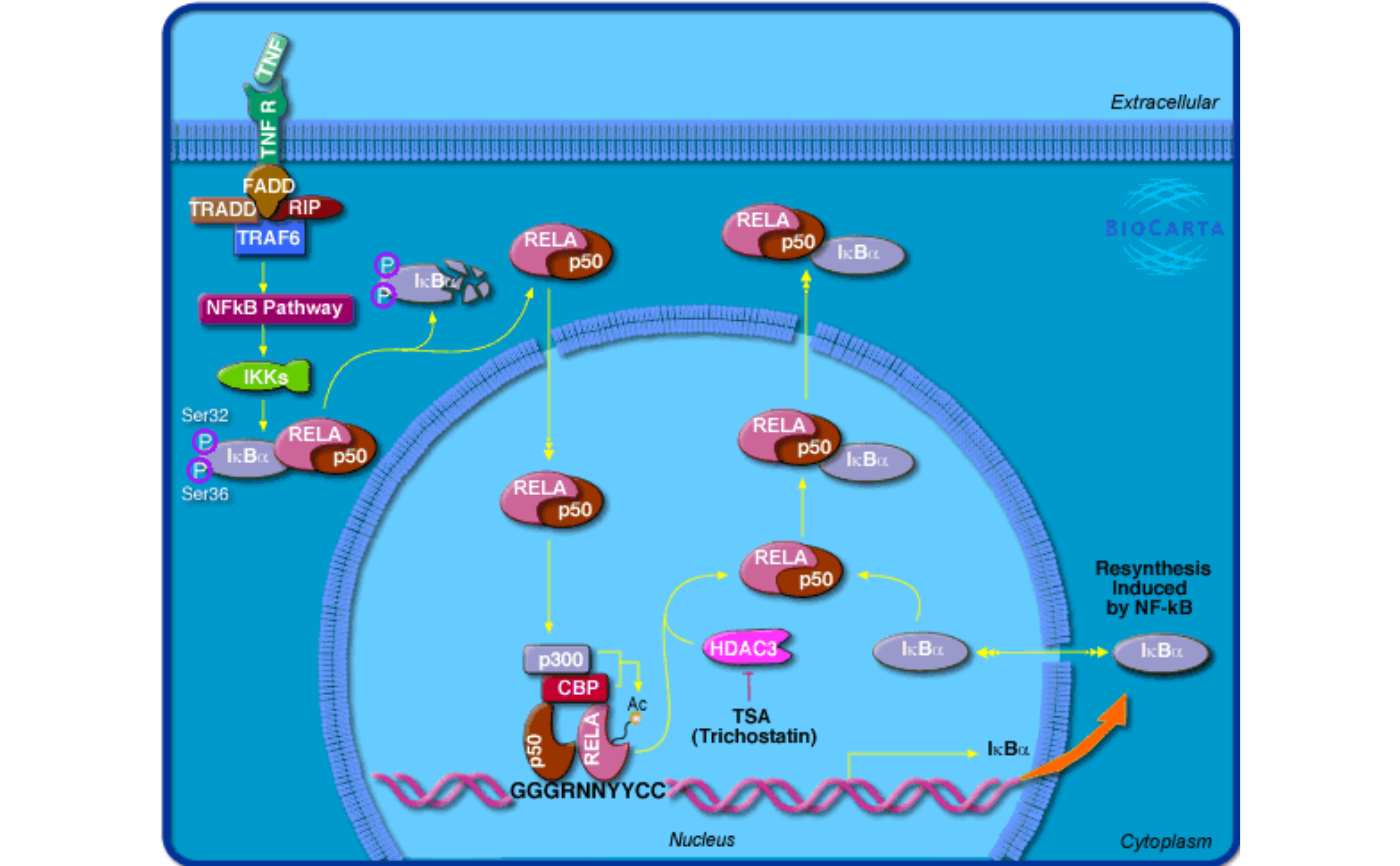 grob = biocartaGrob("h_RELAPathway")