Plot region-gene associations
plotRegionGeneAssociations-GreatObject-method.RdPlot region-gene associations
# S4 method for GreatObject
plotRegionGeneAssociations(object, term_id = NULL, which_plot = 1:3)
Arguments
- object
A
GreatObject-classobject returned bygreat.- term_id
Term ID.
- which_plot
Which plots to draw? The value should be in
1, 2, 3. See "Details" section for explanation.
Details
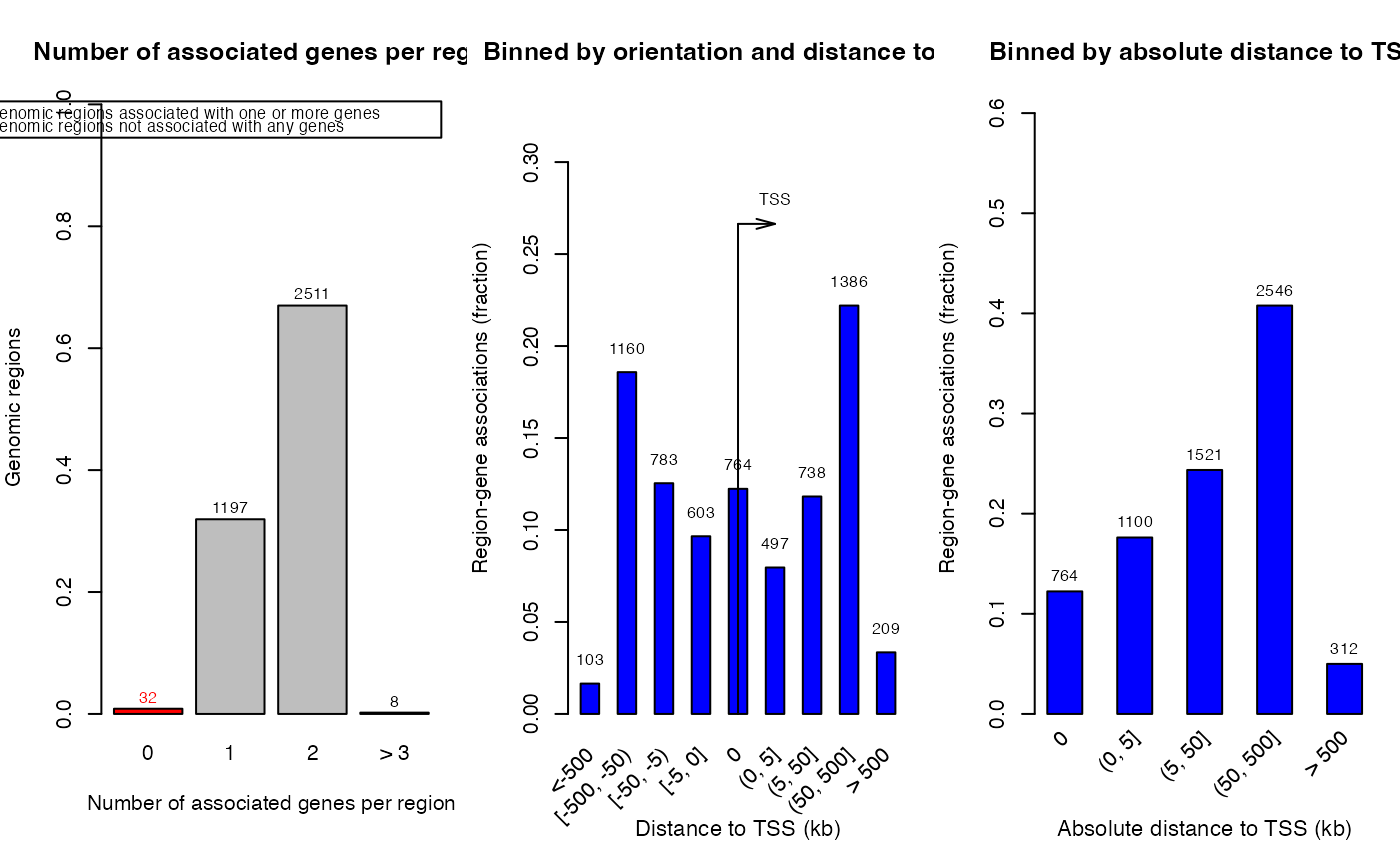
There are following figures:
Association between regions and genes (
which_plot = 1).Distribution of distance to TSS (
which_plot = 2).Distribution of absolute distance to TSS (
which_plot = 3).
Examples
obj = readRDS(system.file("extdata", "GreatObject.rds", package = "rGREAT"))
plotRegionGeneAssociations(obj)