Make plots for comparing clustering methods
Usage
cmp_make_plot(mat, clt, plot_type = c("mixed", "heatmap"), nrow = 3)Arguments
- mat
A similarity matrix.
- clt
A list of clusterings from
cmp_make_clusters.- plot_type
What type of plots to make. See Details.
- nrow
Number of rows of the layout when
plot_typeis set toheatmap.
Details
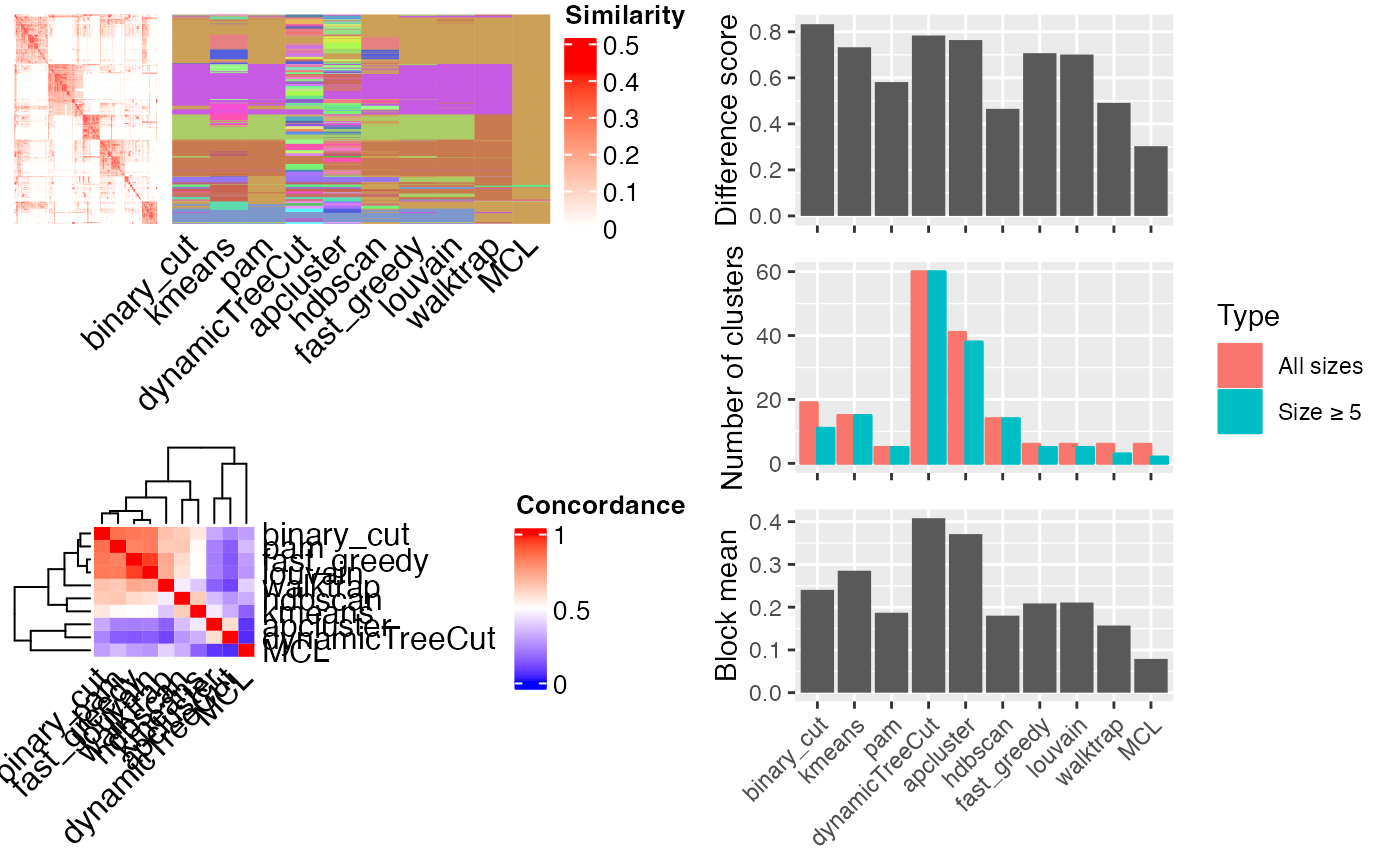
If plot_type is the default value mixed, a figure with three panels generated:
A heatmap of the similarity matrix with different classifications as row annotations.
A heatmap of the pair-wise concordance of the classifications of every two clustering methods.
Barplots of the difference scores for each method (calculated by
difference_score), the number of clusters (total clusters and the clusters with size >= 5) and the mean similarity of the terms that are in the same clusters.
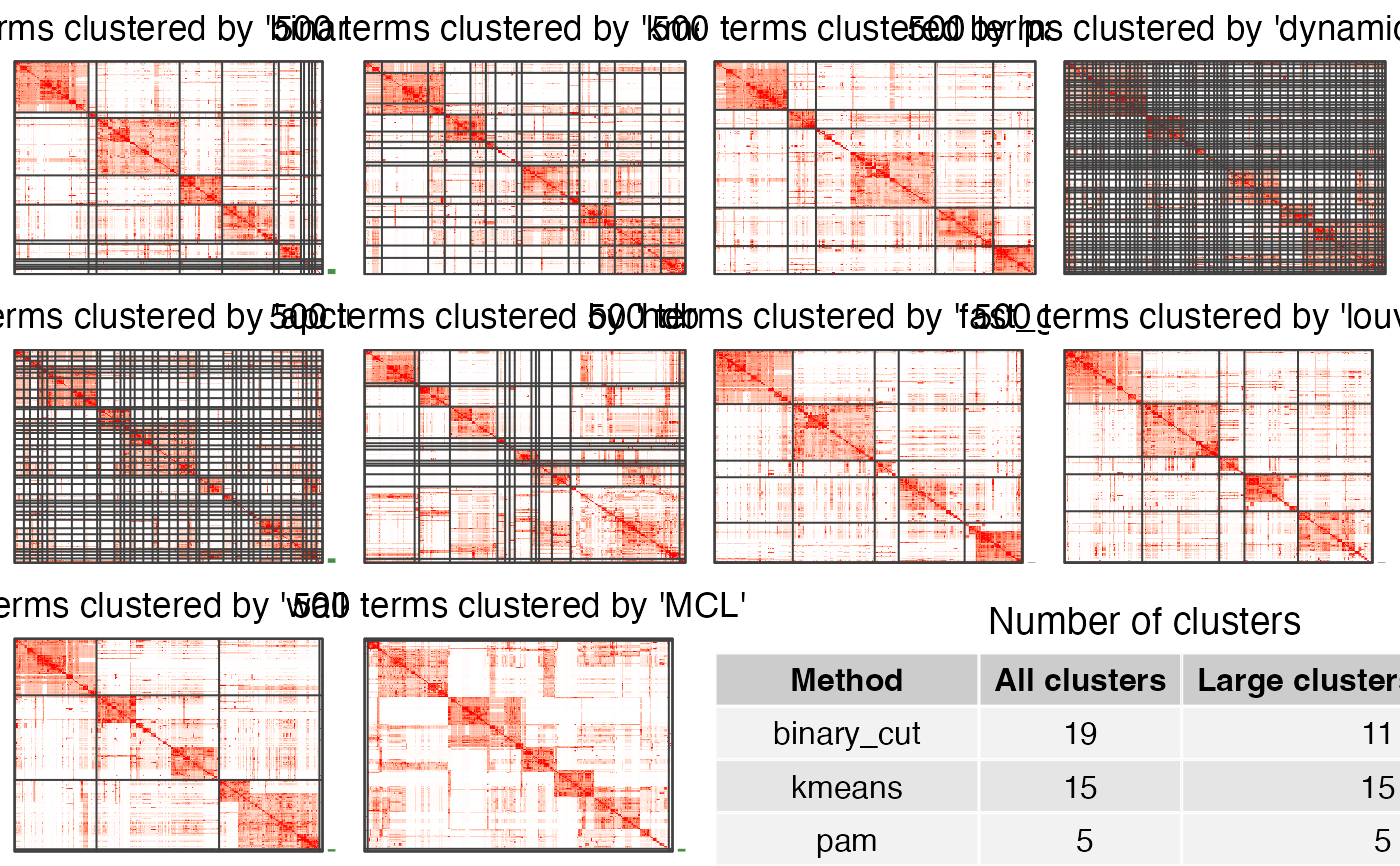
If plot_type is heatmap. There are heatmaps for the similarity matrix under clusterings
from different methods. The last panel is a table with the number of clusters under different
clusterings.
Examples
# \donttest{
mat = readRDS(system.file("extdata", "random_GO_BP_sim_mat.rds",
    package = "simplifyEnrichment"))
clt = cmp_make_clusters(mat)
#> Cluster 500 terms by 'kmeans'...
#>  21 clusters, used 3.146765 secs.
#> Cluster 500 terms by 'pam'...
#>  5 clusters, used 20.66386 secs.
#> Cluster 500 terms by 'dynamicTreeCut'...
#>  60 clusters, used 0.129586 secs.
#> Cluster 500 terms by 'apcluster'...
#>  41 clusters, used 0.8815429 secs.
#> Cluster 500 terms by 'hdbscan'...
#>  14 clusters, used 0.1694231 secs.
#> Cluster 500 terms by 'fast_greedy'...
#>  6 clusters, used 0.07081795 secs.
#> Cluster 500 terms by 'louvain'...
#>  6 clusters, used 0.070678 secs.
#> Cluster 500 terms by 'walktrap'...
#>  6 clusters, used 0.2896349 secs.
#> Cluster 500 terms by 'MCL'...
#>  6 clusters, used 1.792966 secs.
#> Cluster 500 terms by 'binary_cut'...
#>  19 clusters, used 4.505744 secs.
cmp_make_plot(mat, clt)

cmp_make_plot(mat, clt, plot_type = "heatmap")

# }
# }