Draw axis along the spiral
spiral_axis(
  h = c("top", "bottom"),
  at = NULL,
  major_at = at,
  labels = TRUE,
  curved_labels = FALSE,
  minor_ticks = 4,
  major_ticks_length = unit(4, "bigpts"),
  minor_ticks_length = unit(2, "bigpts"),
  ticks_gp = gpar(),
  labels_gp = gpar(fontsize = 6),
  track_index = current_track_index()
)

spiral_xaxis(...)
Arguments
- h
Position of the axis. The value can be a character of "top" or "bottom".
- at
Breaks points on axis.
- major_at
Breaks points on axis. It is the same as
at.- labels
The corresponding labels for the break points.
- curved_labels
Whether are the labels are curved?
- minor_ticks
Number of minor ticks.
- major_ticks_length
Length of the major ticks. The value should be a
grid::unit()object.- minor_ticks_length
Length of the minor ticks. The value should be a
grid::unit()object.- ticks_gp
Graphical parameters for the ticks.
- labels_gp
Graphical parameters for the labels.
- track_index
Index of the track.
- ...
All pass to
spiral_axis().
Value
No value is returned.
Examples
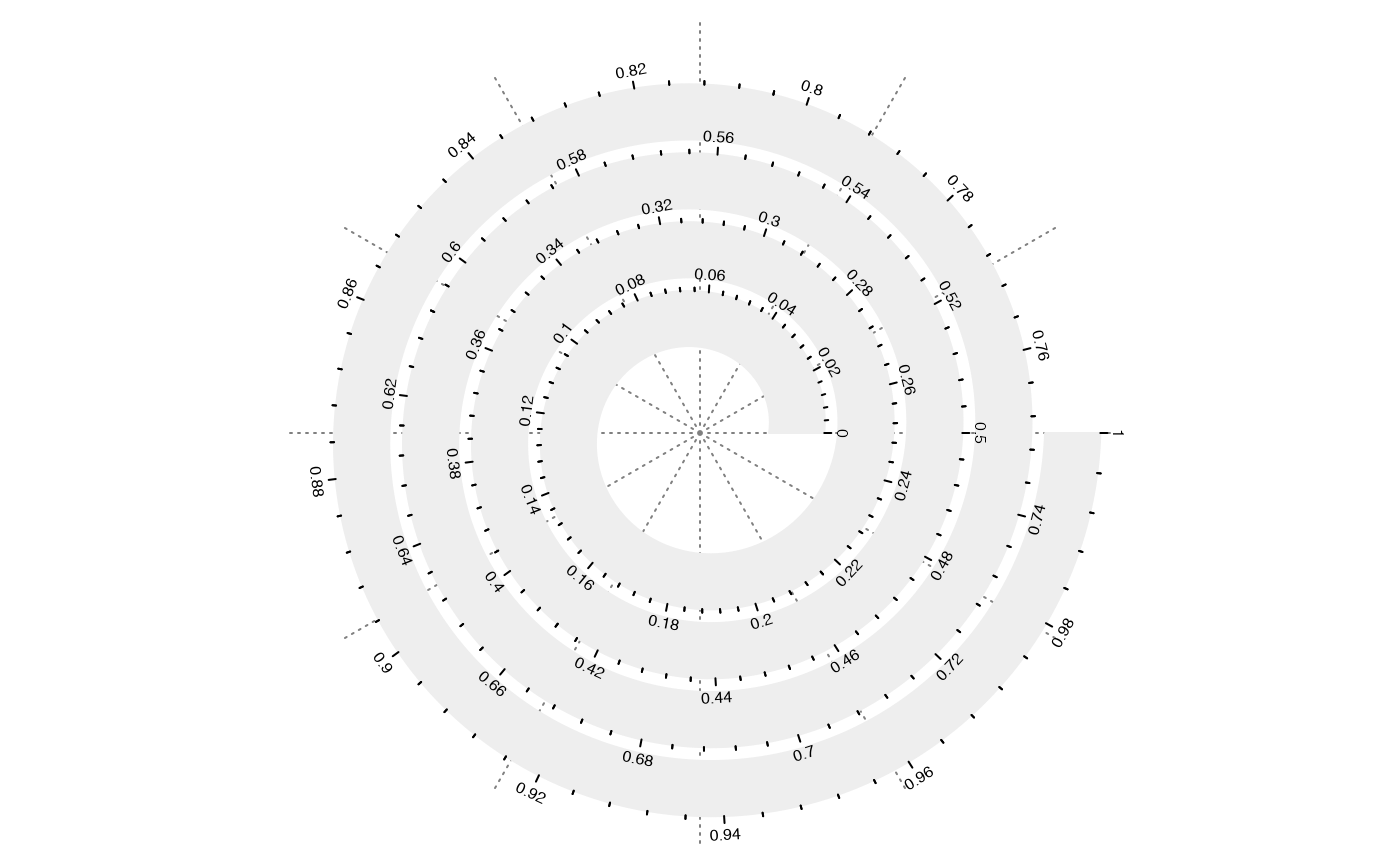
spiral_initialize()
spiral_track()
spiral_axis()


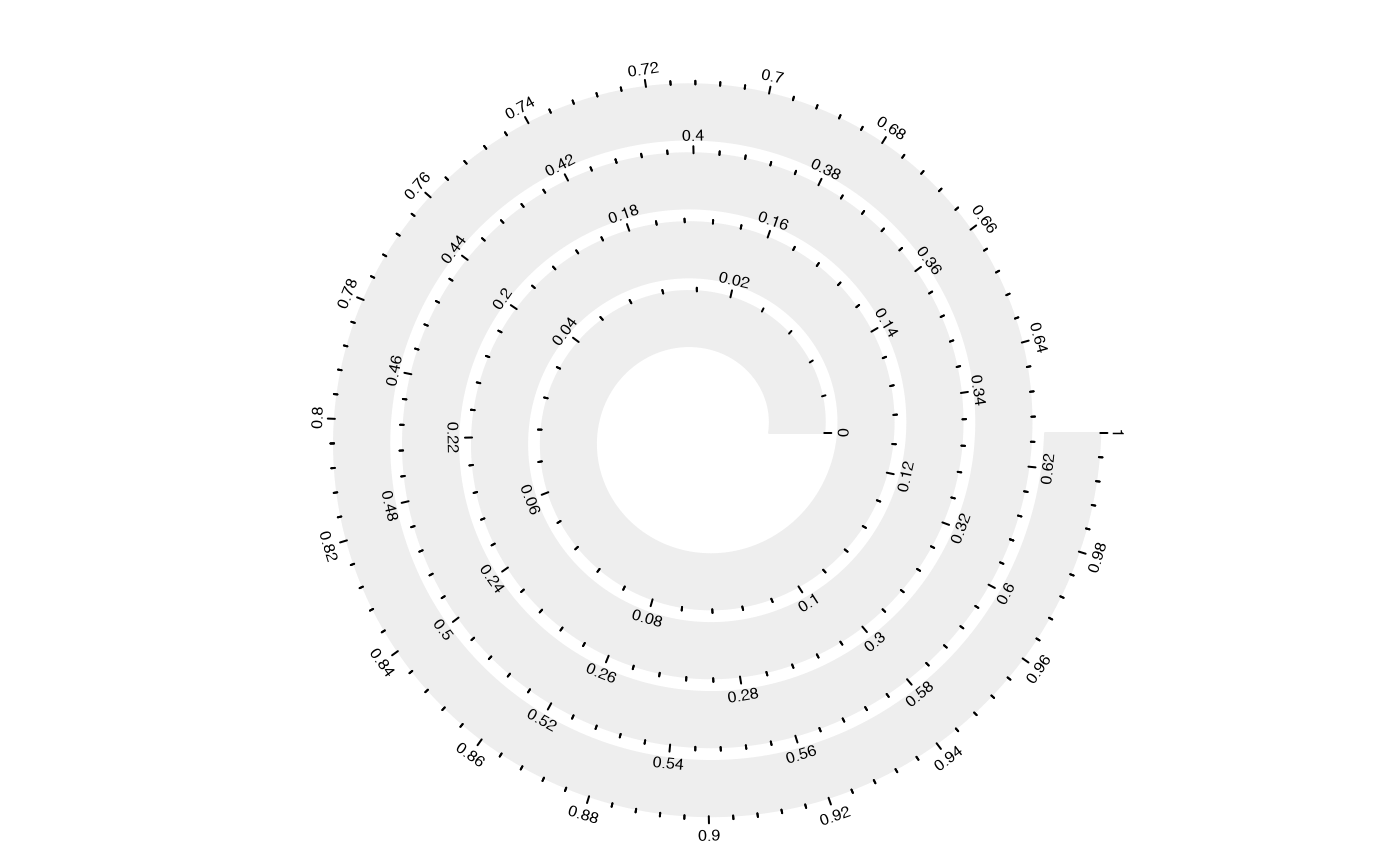
# if the spiral is interpolated by the curve length
spiral_initialize(scale_by = "curve_length"); spiral_track()
spiral_axis()


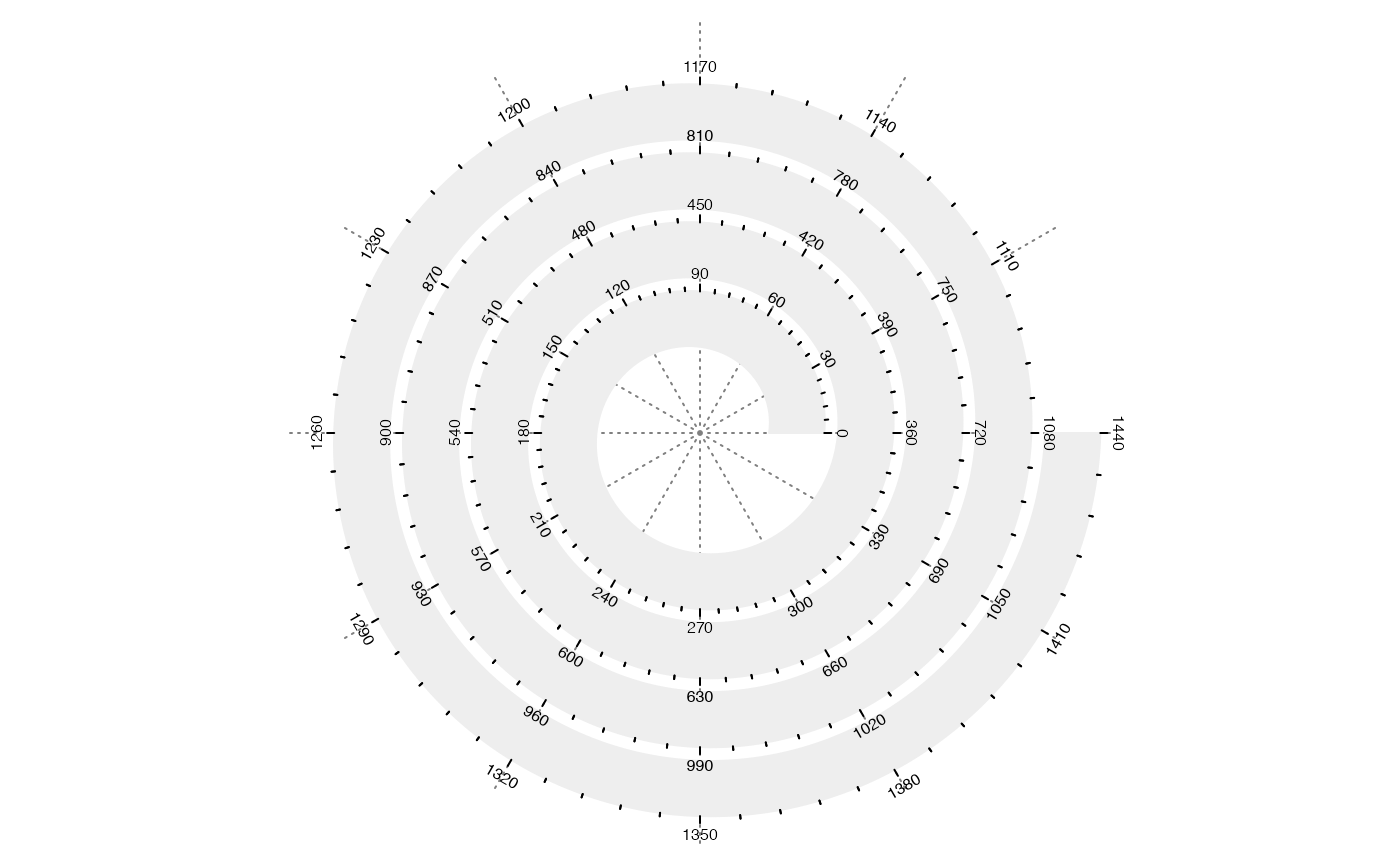
spiral_initialize(xlim = c(0, 360*4), start = 360, end = 360*5); spiral_track()
spiral_axis(major_at = seq(0, 360*4, by = 30))


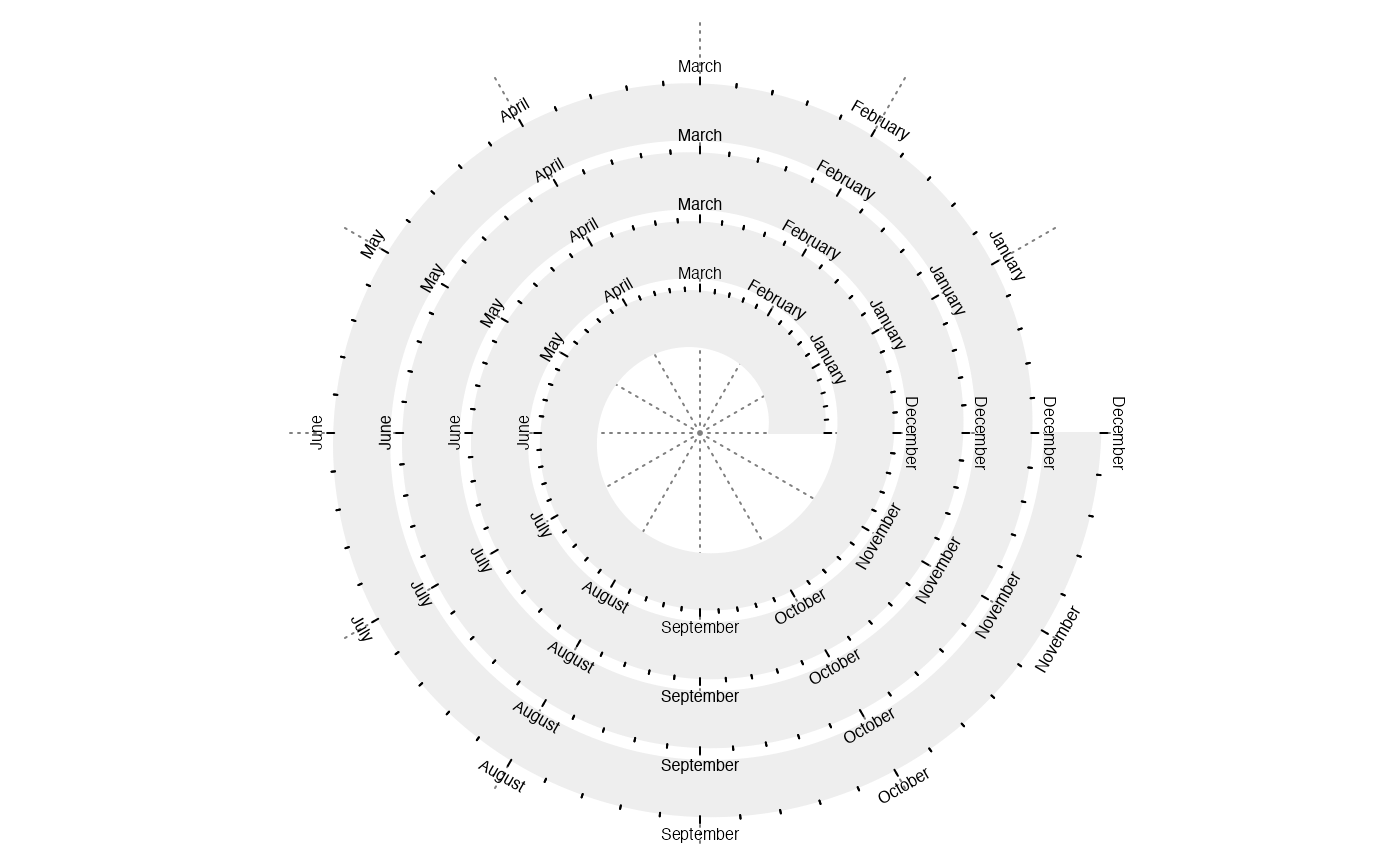
spiral_initialize(xlim = c(0, 12*4), start = 360, end = 360*5); spiral_track()
spiral_axis(major_at = seq(0, 12*4, by = 1), labels = c("", rep(month.name, 4)))
