In this post, I will demonstrate several improvements on the legends in ComplexHeatmap package (version 2.7.1).
First I load the ComplexHeatmap package.
library(ComplexHeatmap)Discrete legends
Now it works with multi-line labels:
lgd = Legend(labels = c("aaaaa\naaaaa", "bbbbb\nbbbbb", "c", "d"),
    legend_gp = gpar(fill = 1:4))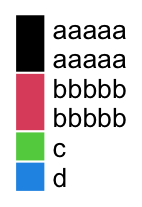
When the multi-line legend labels are in different rows:
lgd = Legend(labels = c("aaaaa\naaaaa", "c", "d", "bbbbb\nbbbbb"),
    legend_gp = gpar(fill = 1:4), nrow = 2)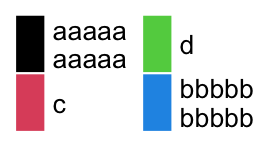
Legend() function has a new argument graphics where users can self-define the graphics
drawn in the legend. Check the following example:
lgd = Legend(labels = letters[1:4],
    graphics = list(
        function(x, y, w, h) grid.rect(x, y, w*0.33, h, gp = gpar(fill = "red")),
        function(x, y, w, h) grid.rect(x, y, w, h*0.33, gp = gpar(fill = "blue")),
        function(x, y, w, h) grid.text("A", x, y, gp = gpar(col = "darkgreen")),
        function(x, y, w, h) grid.points(x, y, gp = gpar(col = "orange"), pch = 16)
    ))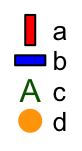
This new feature in mainly used to draw complex legends in oncoPrint.
Continuous legends
I first define a color mapping function by circlize::colorRamp2() function.
library(circlize)
col_fun = colorRamp2(c(-2, 0, 2), c("green", "white", "red"))
By default the legend looks like:
lgd = Legend(col_fun = col_fun, title = "foo")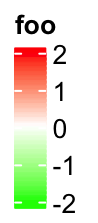
If at is set in the decreasing order, the legend is reversed, i.e. the smallest value
is on the top of the legend.
lgd = Legend(col_fun = col_fun, title = "foo", at = c(2, 1, 0, -1, -2))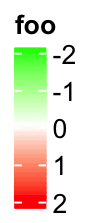
Most continuous legends have legend breaks with equal distance, which I mean, e.g. the distance between the first and the second breaks are the same as the distance between the second and the third breaks. However, there are still special cases where users want to set legend breaks with unequal distances.
In the following example, the color mapping function col_fun_prop visualizes
proportion values with breaks in c(0, 0.05, 0.1, 0.5, 1). The legend breaks
with unequal distance might reflect the different importance of the values in c(0, 1).
For example, maybe we want to see more details in the interval c(0, 0.1).
Following is the default style of the legend where the breaks are selected from 0 to 1 with equal distance.
col_fun_prop = colorRamp2(c(0, 0.05, 0.1, 0.5, 1),
    c("green", "white", "red", "black", "blue"))
lgd = Legend(col_fun = col_fun_prop, title = "Prop")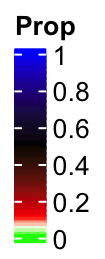
You cann’t see the details in the interval c(0, 0.1), right? This also reminds us that
the breaks set in colorRamp2() only defines the color mapping while not determine
the breaks in the legend.
If we manually select the break values, the color bar keeps the same. The labels are shifted and lines connect them to the original positions. In this case, the distance in the color bar is still proportional to the real difference in the break values, i.e., the distance between 0.5 and 1 is five times longer than 0 and 0.1.
col_fun_prop = colorRamp2(c(0, 0.05, 0.1, 0.5, 1),
    c("green", "white", "red", "black", "blue"))
lgd = Legend(col_fun = col_fun_prop, title = "Prop",
    at = c(0, 0.05, 0.1, 0.5, 1))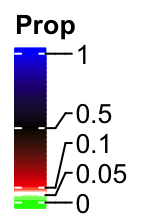
From version 2.7.1, Legend() function has a new argument break_dist that
controls the distance between two neighbouring break values in the legend.
It might be confusing, but from here, when I mention “break distance”, it
always means the visual distance in the legend.
The value of break_dist should have length either one which means all break
values have equal distance in the legend, or length(at) - 1.
lgd = Legend(col_fun = col_fun_prop, title = "Prop", break_dist = 1)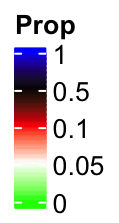
And in the following example, the top two break intervals are three times longer than the bottom two intervals.
lgd = Legend(col_fun = col_fun_prop, title = "Prop", break_dist = c(1, 1, 3, 3))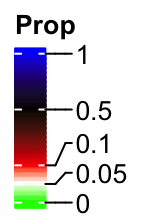
If we increase the legend height by legend_height argument, there will be enough space
for the labels and their positions are not adjusted any more.
lgd = Legend(col_fun = col_fun_prop, title = "Prop", break_dist = c(1, 1, 3, 3),
    legend_height = unit(4, "cm"))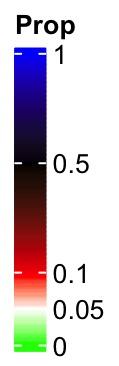
Multi-scheme colors
Imaging following user case, we want to use one color scheme for the values in
c(0, 0.1) and a second color schema for the values in c(0.1, 1), maybe for
the reason that we want to emphasize the two intervals are very different. The
color mapping can be defined as:
col_fun2 = colorRamp2(c(0, 0.1, 0.1+1e-6, 1), c("white", "red", "yellow", "blue"))So here I just added a tiny shift (1e-6) to 0.1 and set it as the lower bound for the
second color scheme. The legend looks like:
lgd = Legend(col_fun = col_fun2, title = "Prop", at = c(0, 0.05, 0.1, 0.5, 1),
    break_dist = c(1, 1, 3, 3), legend_height = unit(4, "cm"))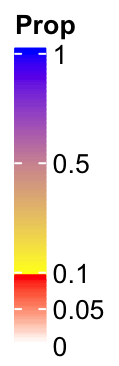
Now you can see the colors are not changed smoothly from 0 to 1 and there are two disticnt color schemes.
Work with heatmaps and annotations
As explained in the ComplexHeatmap
book,
the new arguments be set either via argument heatmap_legend_param in
Heatmap() function or argument annotation_legend_param in
HeatmapAnnotation() function.
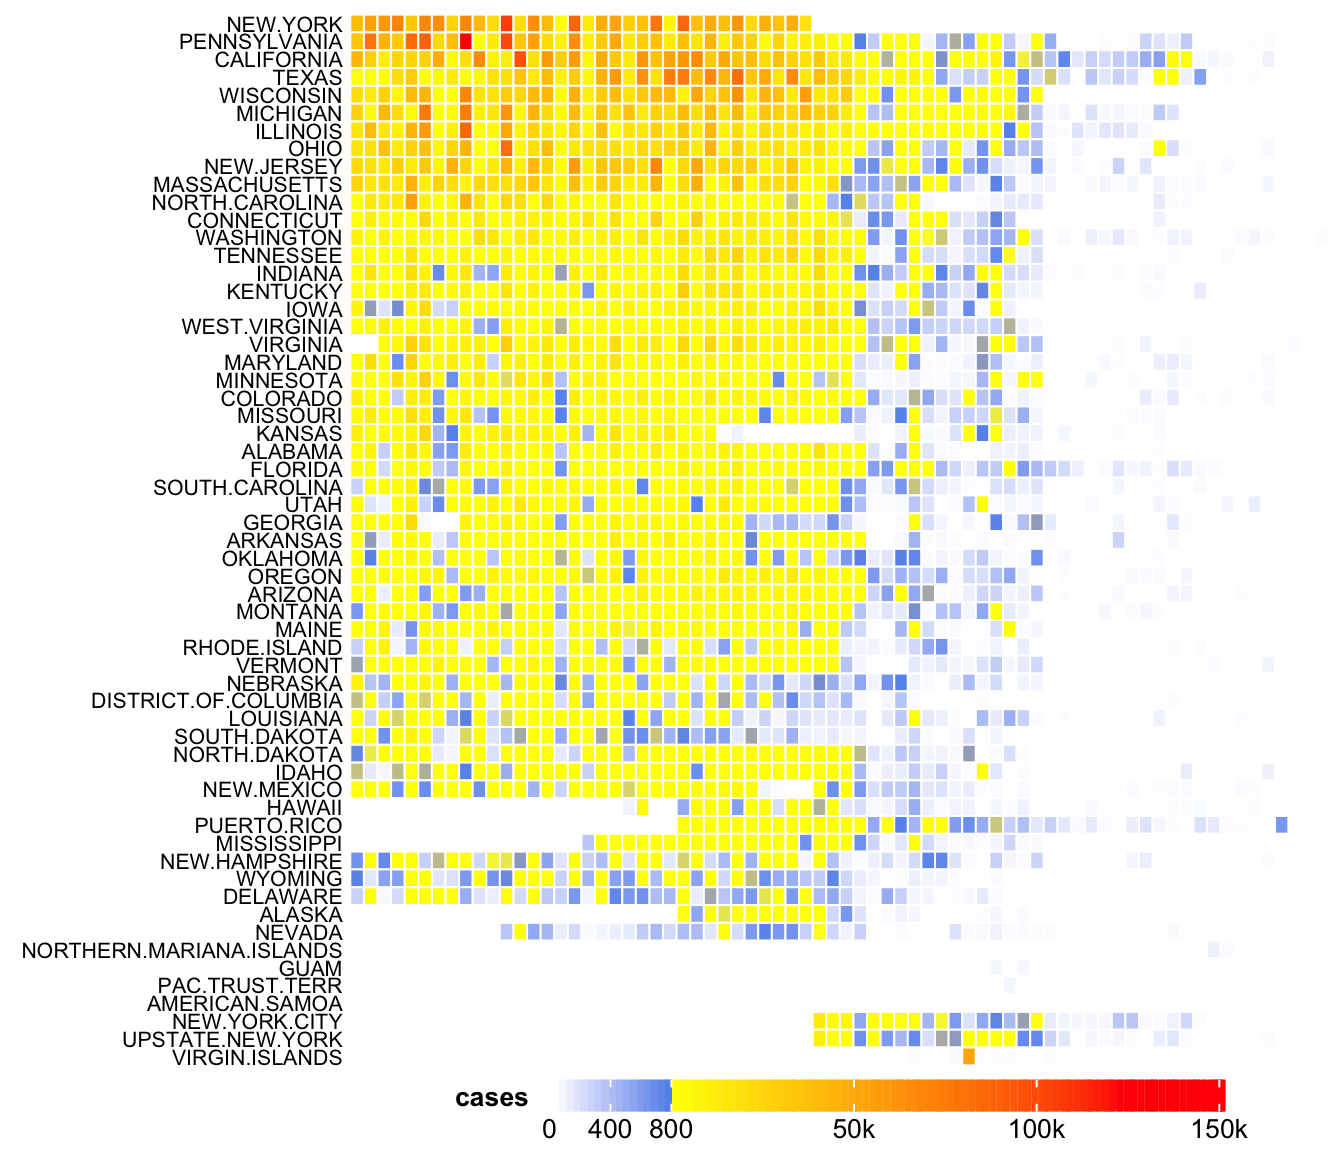
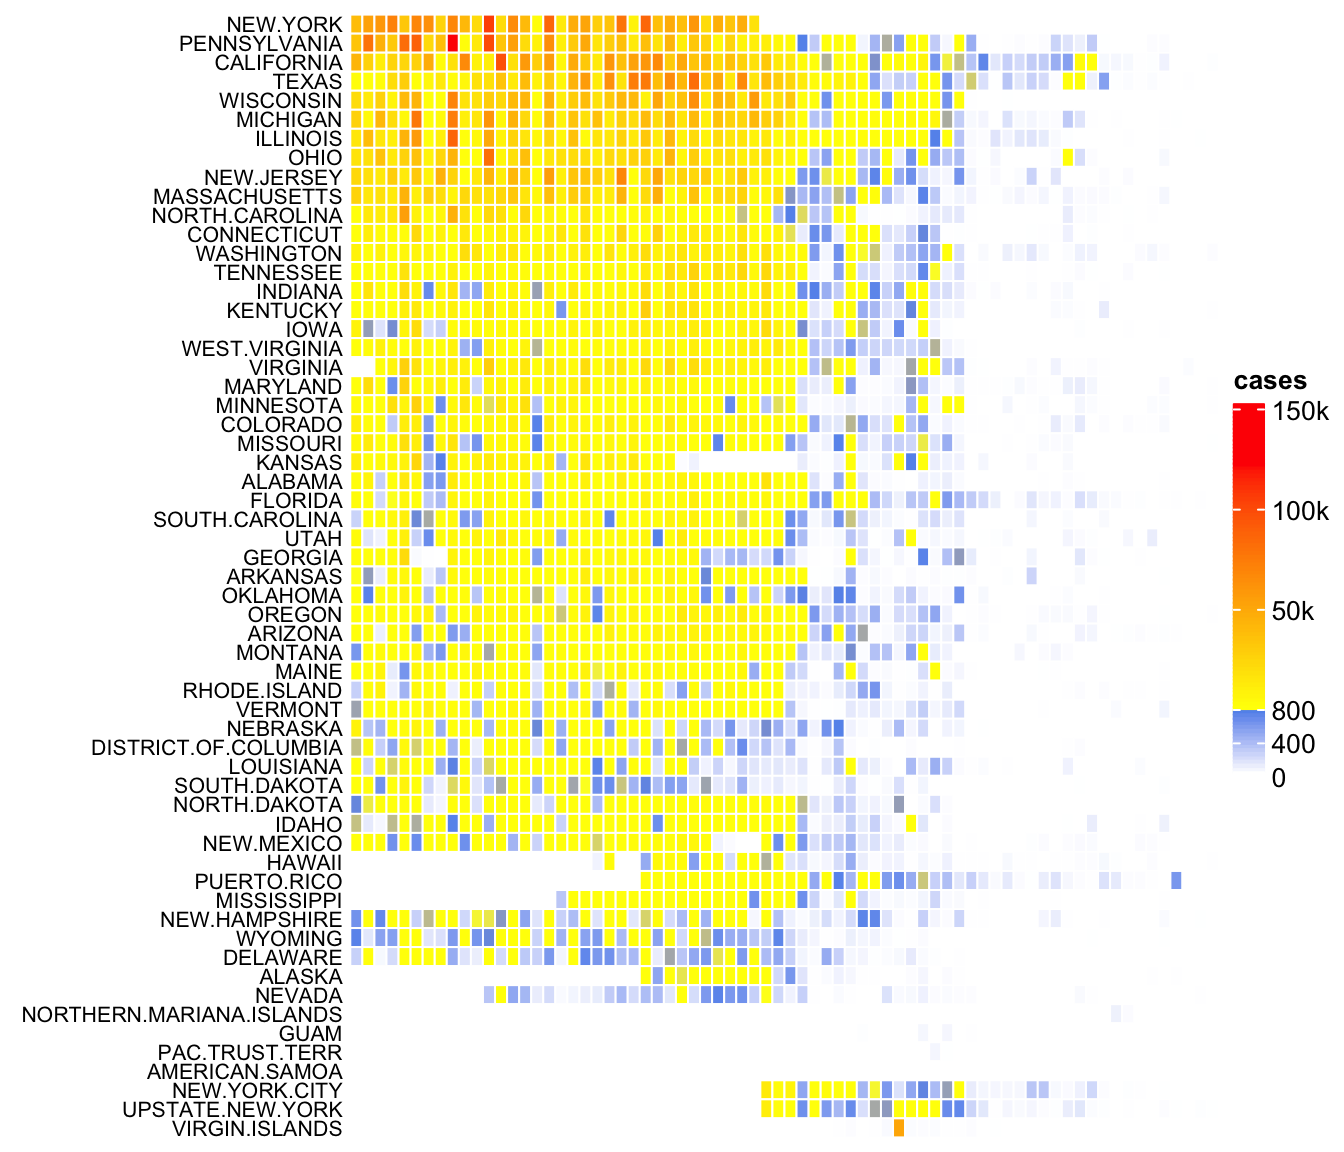
Example with a heatmap
Here I made a simplified version of the measles vaccine heatmap.
Check how I set the heatmap_legend_param argument.
mat = readRDS(system.file("extdata", "measles.rds", package = "ComplexHeatmap"))
col_fun = colorRamp2(c(0, 800, 1000, 127000), c("white", "cornflowerblue", "yellow", "red"))
Heatmap(mat, name = "cases", col = col_fun, rect_gp = gpar(col= "white"),
    cluster_columns = FALSE, show_row_dend = FALSE, show_column_names = FALSE,
    row_names_side = "left", row_names_gp = gpar(fontsize = 8),
    heatmap_legend_param = list(
        at = c(0, 400, 800, 50000, 100000, 150000),
        labels = c("0", "400", "800", "50k", "100k", "150k"),
        break_dist = c(1, 1, 3, 3, 3),
        legend_gp = gpar(col = "black"),
        legend_height = unit(5, "cm")
    )
)
I can also adjust the legend to put it at the bottom of the heatmap.
ht = Heatmap(mat, name = "cases", col = col_fun, rect_gp = gpar(col= "white"),
    cluster_columns = FALSE, show_row_dend = FALSE, show_column_names = FALSE,
    row_names_side = "left", row_names_gp = gpar(fontsize = 8),
    heatmap_legend_param = list(
        at = c(0, 400, 800, 50000, 100000, 150000),
        labels = c("0", "400", "800", "50k", "100k", "150k"),
        break_dist = c(1, 1, 3, 3, 3),
        legend_gp = gpar(col = "black"),
        legend_width = unit(9, "cm"),
        direction = "horizontal",
        title_position = "lefttop"
    )
)
draw(ht, heatmap_legend_side = "bottom")