ComplexHeatmap already provides many annotation functions that draw various types of graphics, but still, users might want more new types. Here I demonstrate how to create new annotation graphics.
In the ComplexHeatmap book (https://jokergoo.github.io/ComplexHeatmap-reference/book/heatmap-annotations.html#implement-new-annotation-functions),
I have already explained how to create new annotations with the function AnnotationFunction(). Here I demonstrate a simplified way
to construct a new annotation type which also allows reordering, subsetting and splitting.
From version 2.9.3, AnnotationFunction() allows a new argument cell_fun which draws graphics in every single “annotation cell”. The value
for cell_fun is a self-defind graphics function and the only argument is the “current index” of the corresponding heatmap rows or columns.
In the following example, I will create a new row annotation type which visualizes a list of percentage values by horizontal bars as well as the text
of the percent values added on top of bars. I first give the function definition of anno_pct() which generate such annotation:
library(ComplexHeatmap)
anno_pct = function(x) {
    max_x = max(x)
    text = paste0(sprintf("%.2f", x*100), "%")
    cell_fun_pct = function(i) {
        pushViewport(viewport(xscale = c(0, max_x)))
        grid.roundrect(x = unit(1, "npc"),
            width = unit(x[i], "native"), height = unit(1, "npc") - unit(4, "pt"),
            just = "right", gp = gpar(fill = "#0000FF80", col = NA))
        grid.text(text[i], x = unit(1, "npc"), just = "right")
        popViewport()
    }

    AnnotationFunction(
        cell_fun = cell_fun_pct,
        var_import = list(max_x, x, text),
        which = "row",
        width = max_text_width(text)*1.25
    )
}
The code is simple. cell_fun_pct() draws a horizontal bar and a text for the ith row. Then cell_fun_pct() is sent to the constructor function
to generate the new annotation.
We can test this new annotation function:
set.seed(123)
x = runif(10)
ha = rowAnnotation(foo = anno_pct(x), annotation_name_rot = 0)
m = matrix(rnorm(100), 10)
rownames(m) = round(x, 2)
ha + Heatmap(m)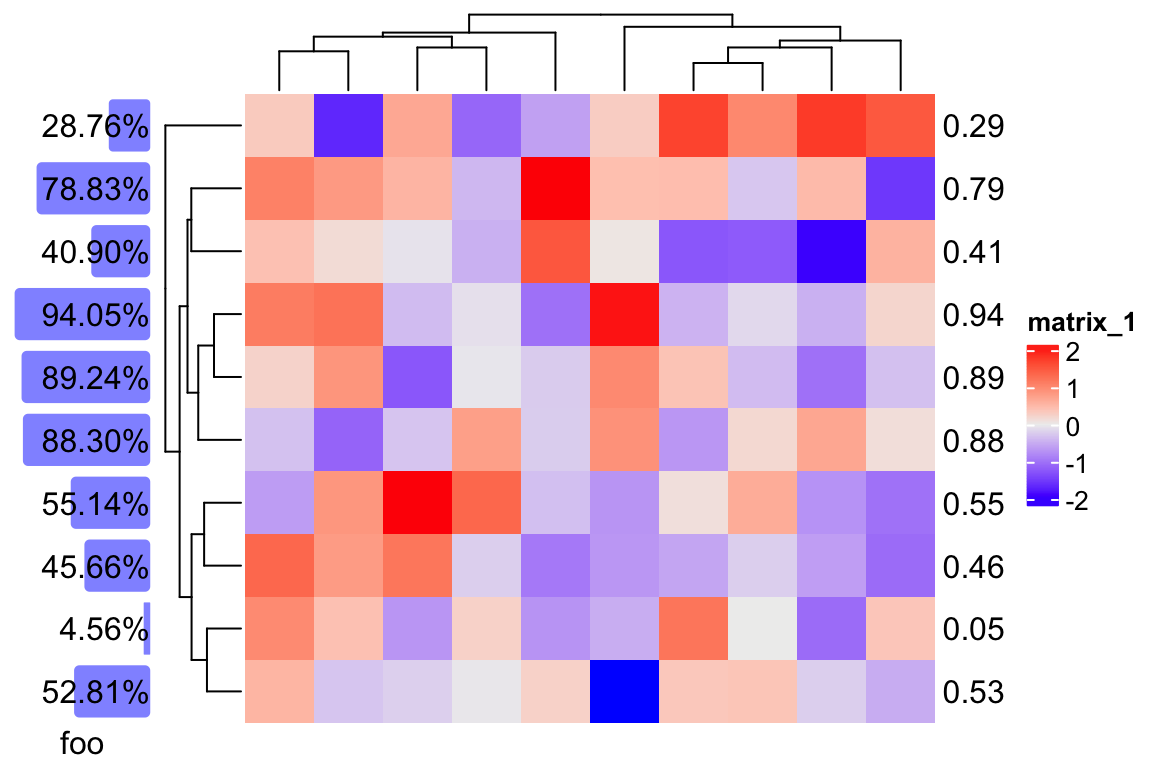
And if we split the heatmap rows:
ha + Heatmap(m, row_km = 2)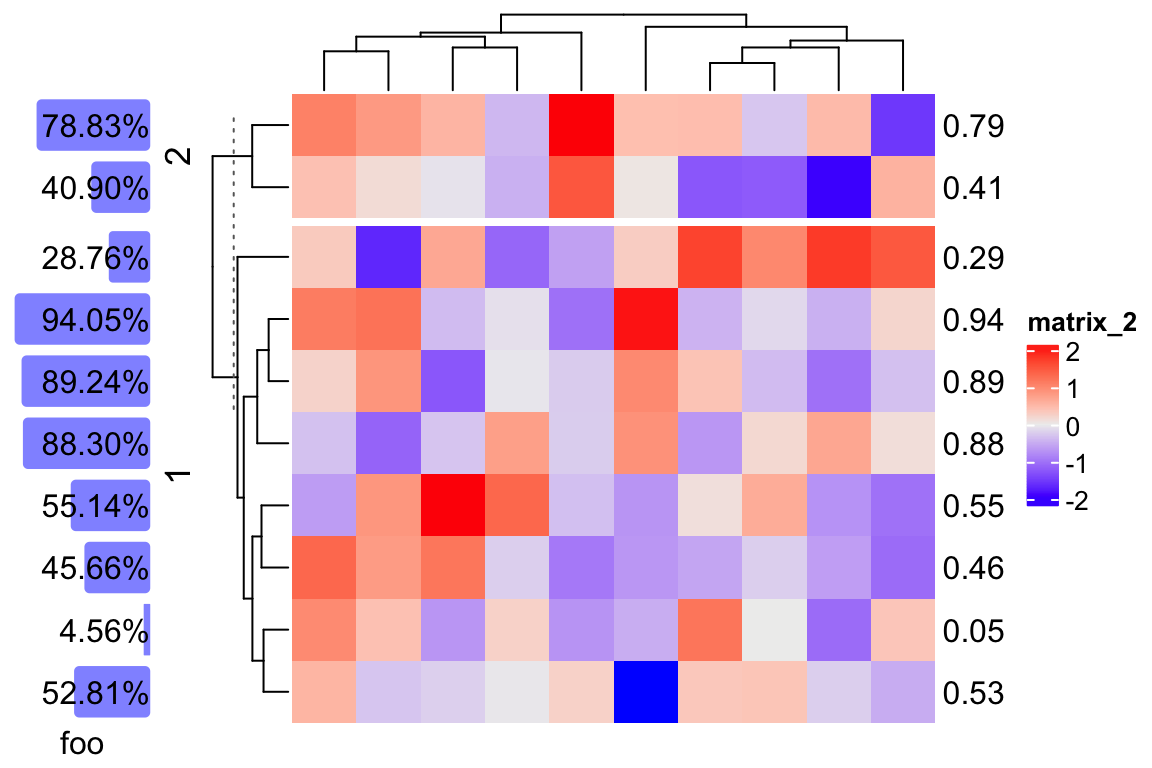
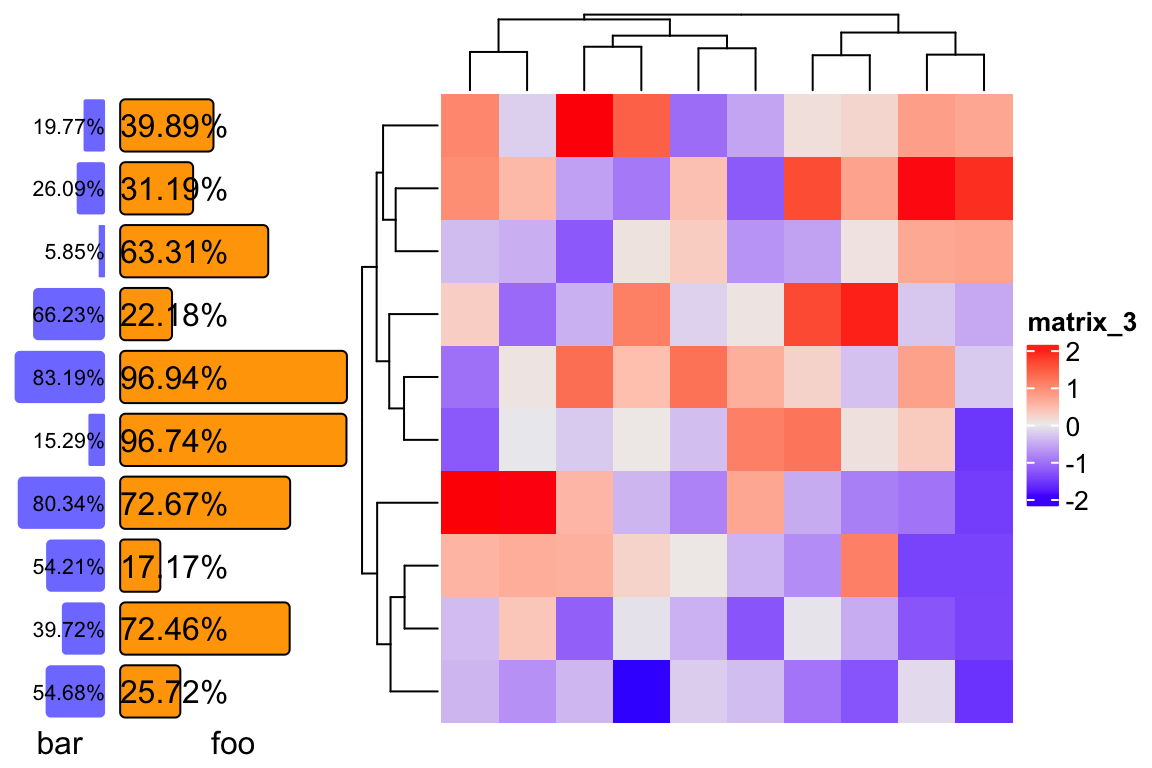
We can make anno_pct() slightly more complex to allow more controls:
anno_pct = function(x, bg_gp = gpar(fill = "#8080FF", col = NA), labels_gp = gpar(),
    align_to = "right", width = NULL) {

    max_x = max(x)
    text = paste0(sprintf("%.2f", x*100), "%")
    cell_fun_pct = function(i) {
        pushViewport(viewport(xscale = c(0, max_x)))
        if(align_to == "right") {
            grid.roundrect(x = unit(1, "npc"),
                width = unit(x[i], "native"), height = unit(1, "npc") - unit(4, "pt"),
                just = "right", gp = subset_gp(bg_gp, i))
            grid.text(text[i], x = unit(1, "npc"), just = "right", gp = subset_gp(labels_gp, i))
        } else {
            grid.roundrect(x = unit(0, "npc"),
                width = unit(x[i], "native"), height = unit(1, "npc") - unit(4, "pt"),
                just = "left", gp = subset_gp(bg_gp, i))
            grid.text(text[i], x = unit(0, "npc"), just = "left", gp = subset_gp(labels_gp, i))
        }
        popViewport()
    }

    if(is.null(width)) {
        width = max_text_width(text, gp = labels_gp)*1.25
    }
    AnnotationFunction(
        cell_fun = cell_fun_pct,
        var_import = list(max_x, x, text, labels_gp, align_to, bg_gp),
        which = "row",
        width = width
    )
}
ha1 = rowAnnotation(bar = anno_pct(runif(x), labels_gp = gpar(fontsize = 8)),
annotation_name_rot = 0)
ha2 = rowAnnotation(foo = anno_pct(runif(x), bg_gp = gpar(fill = "orange"),
align_to = "left", width = unit(3, "cm")), annotation_name_rot = 0)
m = matrix(rnorm(100), 10)
ha1 + ha2 + Heatmap(m)