Constructor of AnnotationFunction Class
AnnotationFunction.RdConstructor of AnnotationFunction Class
AnnotationFunction(fun, fun_name = "", which = c("column", "row"),
    var_import = list(), n = NA, data_scale = c(0, 1), subset_rule = list(),
    subsetable = length(subset_rule) > 0, show_name = TRUE, width = NULL, height = NULL)
Arguments
| fun | A function which defines how to draw the annotation. See **Details** section. |
|---|---|
| fun_name | The name of the function. It is only used for printing the object. |
| which | Whether it is drawn as a column annotation or a row annotation? |
| var_import | The names of the variables or the variable themselves that the annotation function depends on. See **Details** section. |
| n | Number of observations in the annotation. It is not mandatory, but it is better to provide this information so that the higher order |
| data_scale | The data scale on the data axis (y-axis for column annotation and x-axis for row annotation). It is only used when |
| subset_rule | The rule of subsetting variables in |
| subsetable | Whether the object is subsetable? |
| show_name | It is used to turn off the drawing of annotation names in |
| width | The width of the plotting region (the viewport) that the annotation is drawn. If it is a row annotation, the width must be an absolute unit. Since the |
| height | The height of the plotting region (the viewport) that the annotation is drawn. If it is a column annotation, the width must be an absolute unit. |
Details
In the package, we have implemted quite a lot annotation functions by AnnotationFunction constructor:
anno_empty, anno_image, anno_points, anno_lines, anno_barplot, anno_boxplot, anno_histogram,
anno_density, anno_joyplot, anno_horizon, anno_text and anno_mark. These built-in annotation functions
support as both row annotations and column annotations and they are are all subsettable.
The build-in annotation functions are already enough for most of the analysis, nevertheless, if users want to know more about how to construct the AnnotationFunction class manually, they can refer to https://jokergoo.github.io/ComplexHeatmap-reference/book/heatmap-annotations.html#implement-new-annotation-functions.
Value
A AnnotationFunction-class object which can be used in HeatmapAnnotation.
Examples
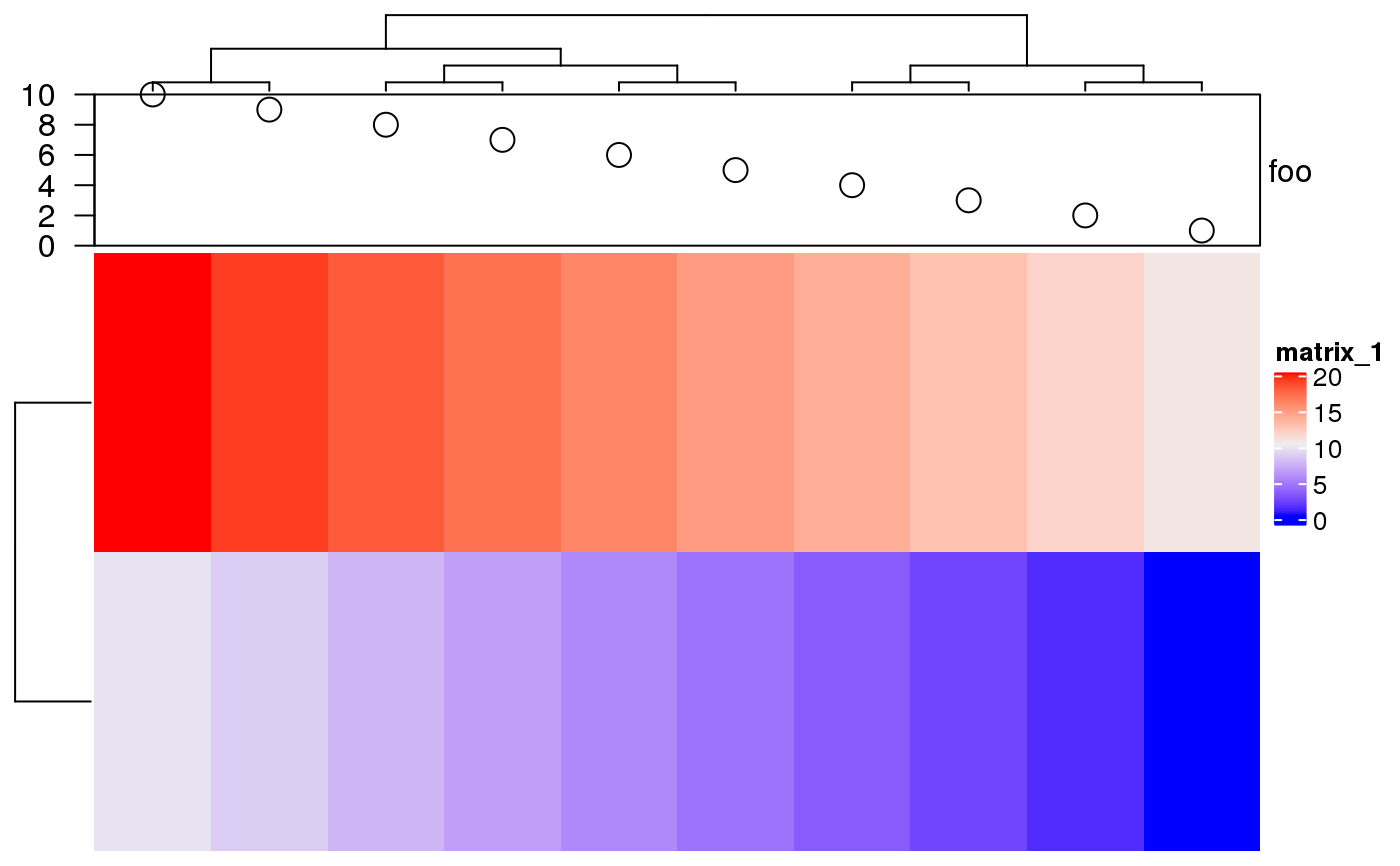
x = 1:10 anno1 = AnnotationFunction( fun = function(index, k, n) { n = length(index) pushViewport(viewport(xscale = c(0.5, n + 0.5), yscale = c(0, 10))) grid.rect() grid.points(1:n, x[index], default.units = "native") if(k == 1) grid.yaxis() popViewport() }, var_import = list(x = x), n = 10, subsetable = TRUE, height = unit(2, "cm") ) m = rbind(1:10, 11:20) Heatmap(m, top_annotation = HeatmapAnnotation(foo = anno1))