Plot region-gene associations
plotRegionGeneAssociations-GreatJob-method.RdPlot region-gene associations
# S4 method for GreatJob
plotRegionGeneAssociations(object, ontology = NULL, term_id = NULL, which_plot = 1:3,
    request_interval = 10, max_tries = 100, verbose = great_opt$verbose)
Arguments
- object
A
GreatJob-classobject returned bysubmitGreatJob.- ontology
A single ontology names. Valid values are in
availableOntologies.- term_id
Term id in the selected ontology
- which_plot
Which plots to draw? The value should be in
1, 2, 3. See "Details" section for explanation.- request_interval
Time interval for two requests. Default is 300 seconds.
- max_tries
Maximal times for automatically reconnecting GREAT web server.
- verbose
Whether to show messages.
Details
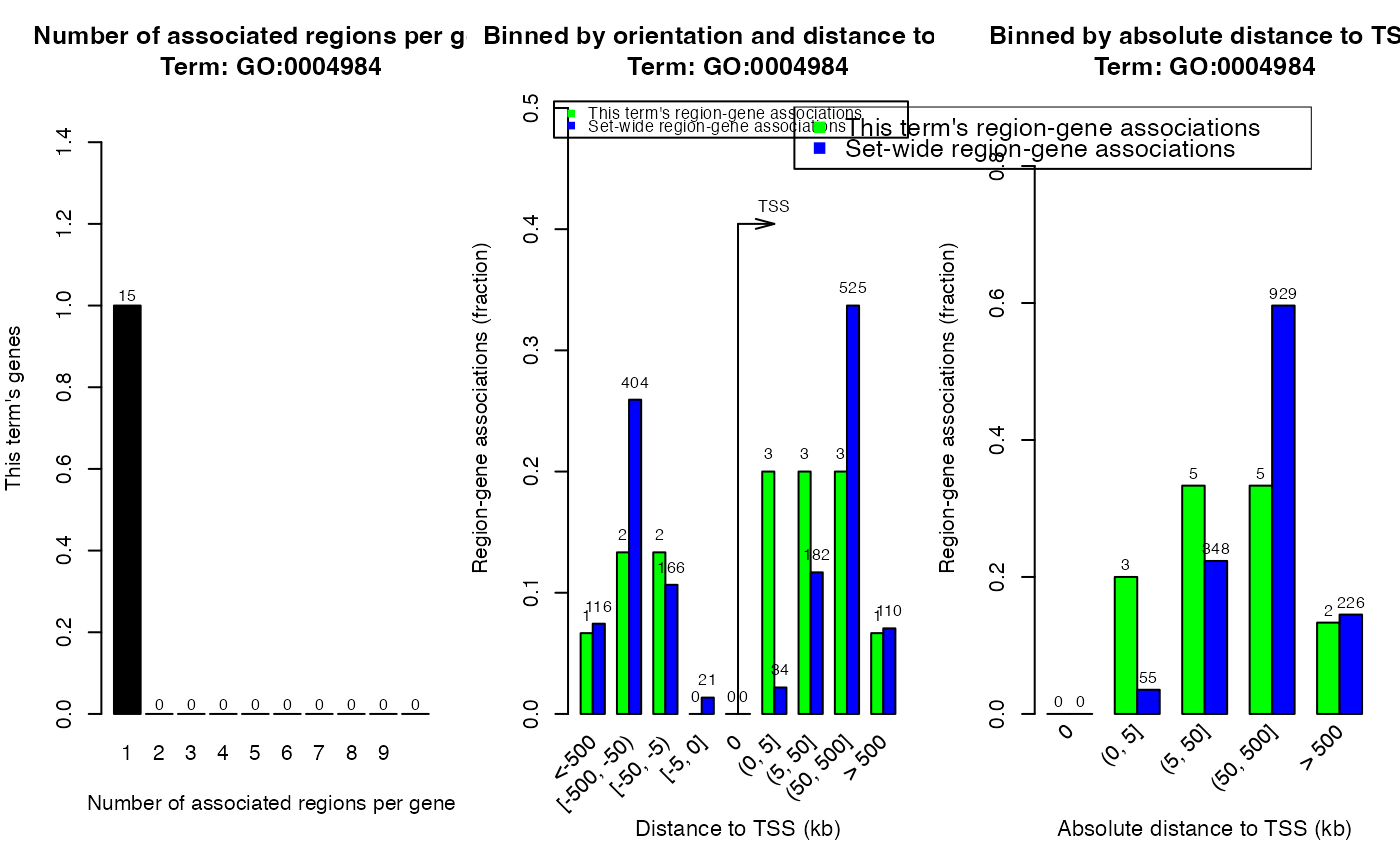
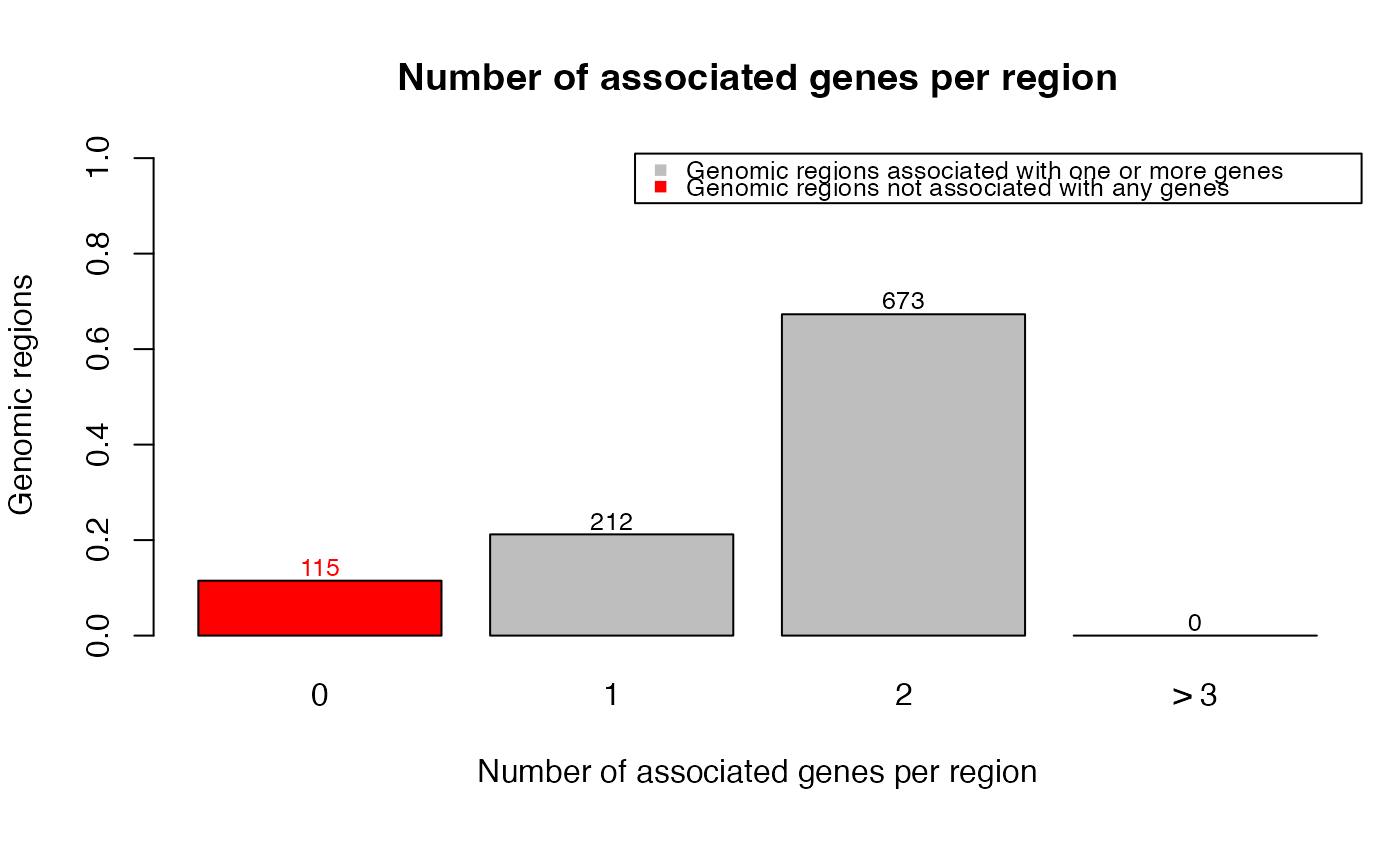
There are following figures:
Association between regions and genes (
which_plot = 1).Distribution of distance to TSS (
which_plot = 2).Distribution of absolute distance to TSS (
which_plot = 3).
If ontology and term_id are set, only regions and genes corresponding to
selected ontology term will be used. Valid value for ontology is in
availableOntologies and valid value for term_id is from 'id' column
in the table which is returned by getEnrichmentTables.
Examples
job = readRDS(system.file("extdata", "GreatJob.rds", package = "rGREAT"))

plotRegionGeneAssociations(job)

plotRegionGeneAssociations(job, which_plot = 1)

# Do not use other term_id for this example, or you need to generate a new `job` object.
plotRegionGeneAssociations(job, ontology = "GO Molecular Function",
    term_id = "GO:0004984")
#> The webpage for 'GO Molecular Function:GO:0004984' is available at:
#>   http://great.stanford.edu/public-4.0.4/cgi-bin/showTermDetails.php?termId=GO:0004984&ontoName=GOMolecularFunction&ontoUiName=GO Molecular Function&sessionName=20230401-public-4.0.4-Amwjvn&species=&foreName=fileba3c45b28db3.gz&backName=&table=region
#>  Note the web page might be deleted from GREAT web server because it is only for temporary use.
# Do not use other term_id for this example, or you need to generate a new `job` object.
plotRegionGeneAssociations(job, ontology = "GO Molecular Function",
term_id = "GO:0004984")
#> The webpage for 'GO Molecular Function:GO:0004984' is available at:
#> http://great.stanford.edu/public-4.0.4/cgi-bin/showTermDetails.php?termId=GO:0004984&ontoName=GOMolecularFunction&ontoUiName=GO Molecular Function&sessionName=20230401-public-4.0.4-Amwjvn&species=&foreName=fileba3c45b28db3.gz&backName=&table=region
#> Note the web page might be deleted from GREAT web server because it is only for temporary use.