Initialize the spiral from time objects
Arguments
- xlim
Range of the time. The value can be time object such as
base::Date,base::POSIXltorbase::POSIXct. The value can also be characters and it is converted to time objects automatically.- start
Start of the spiral, in degrees. By default it is automatically calculated.
- end
End of the spiral, in degrees. By default it is automatically calculated.
- unit_on_axis
Units on the axis.
- period
Which period to use?
- normalize_year
Whether to enforce one spiral loop to represent a complete year?
- period_per_loop
How many periods to put in a spiral loop?
- polar_lines_by
By default different value of
polar_lines_byis set for differentperiod. E.g. 360/7 is set ifperiodis "weeks" or 360/24 is set ifperoidis set to "hours". Whenperiodis year andunit_on_axisis day, the proportion of sectors by polar lines corresponds to the proportion of month days in a year.- verbose
Whether to print messages?
- ...
All pass to
spiral_initialize().
Value
No value is returned.
Details
"start" and "end" are automatically calculated for different "unit_on_axis" and "period". For example, if "unit_on_axis" is "days" and "period" is "years", then
the first day of each each year is always put on theta = 0 + 2*pi*k where k is the index of spiral loops.
Examples
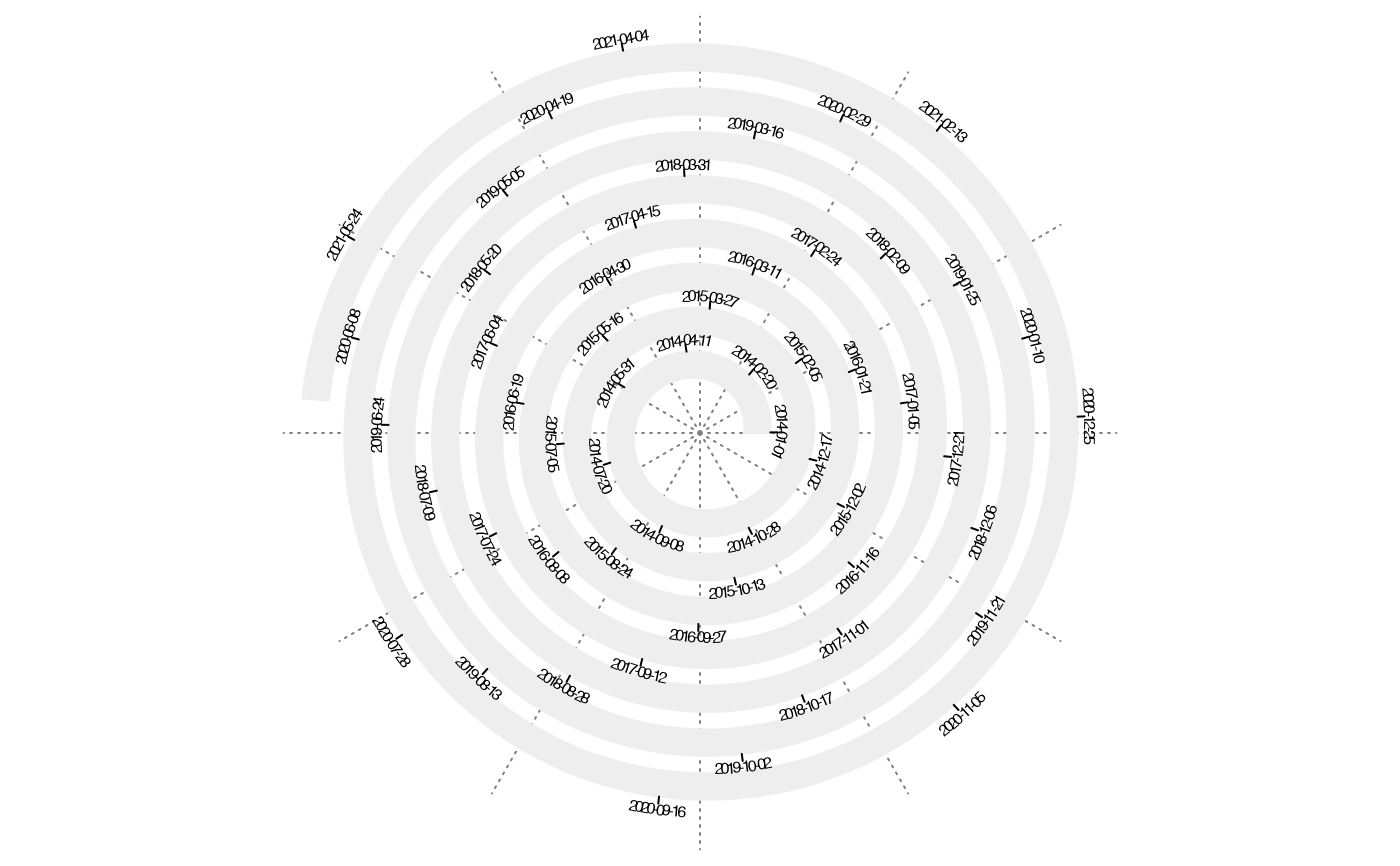
spiral_initialize_by_time(xlim = c("2014-01-01", "2021-06-17"))
#> 'unit_to_axis' is set to 'days'.
#> 'period' is set to 'years'.
#> When the period is year and the unit on axis is day, a spiral loop can
#> only represent 364 days (52 weeks) under default settings, which helps
#> to correspond weekdays between years, but 1 or 2 days from the current
#> year will be moved and accumulated to the next year. You can set
#> argument `normalize_year = TRUE` to enforce every spiral loop to
#> represent a complete year, but note you might not be able to perfectly
#> correspond weekdays between different years. Set argument `verbose =
#> FALSE` to turn off this message.
spiral_track(height = 0.6)
spiral_axis()
 spiral_initialize_by_time(xlim = c("2021-01-01 00:00:00", "2021-01-05 00:00:00"))
#> 'unit_to_axis' is set to 'mins'.
#> 'period' is set to 'days'.
spiral_track(height = 0.6)
spiral_axis()
spiral_initialize_by_time(xlim = c("2021-01-01 00:00:00", "2021-01-05 00:00:00"))
#> 'unit_to_axis' is set to 'mins'.
#> 'period' is set to 'days'.
spiral_track(height = 0.6)
spiral_axis()
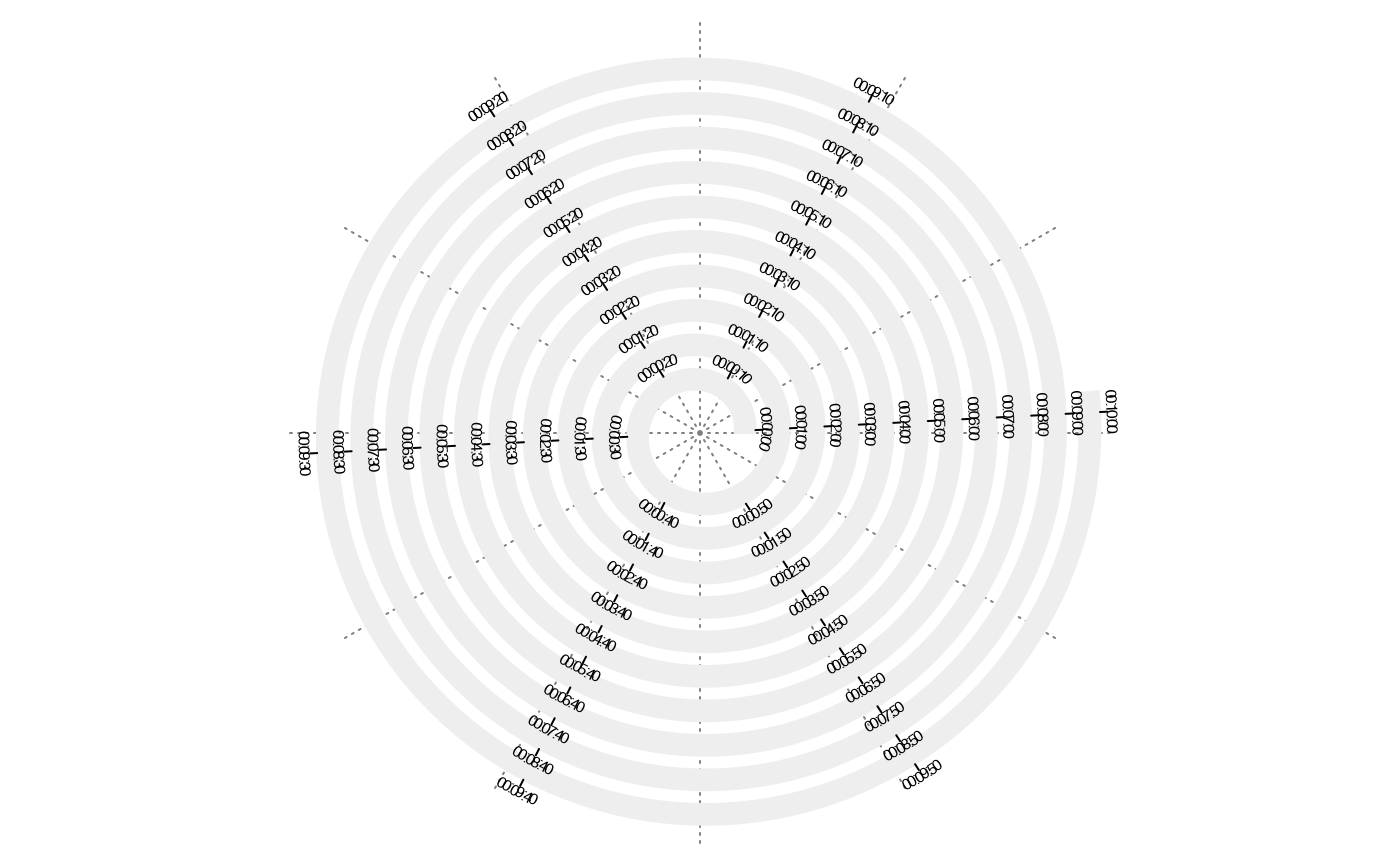
 spiral_initialize_by_time(xlim = c("2021-01-01 00:00:00", "2021-01-01 00:10:00"),
unit_on_axis = "secs", period = "mins")
spiral_track(height = 0.6)
spiral_axis()
spiral_initialize_by_time(xlim = c("2021-01-01 00:00:00", "2021-01-01 00:10:00"),
unit_on_axis = "secs", period = "mins")
spiral_track(height = 0.6)
spiral_axis()