4 A List of Heatmaps
The main feature of ComplexHeatmap package is it supports to concatenate a list of heatmaps and annotations horizontally or vertically so that it makes it possible to visualize the associations from various sources of information. In this chapter, we mainly introduce the horizontal concatenation because this is the major case we will use in the analysis. In the end we show some examples of vertical concatenation. The concept behind for horizontal and vertical concatenation basically is similar.
For the horizontal concatenation, the number of rows for all heatmaps and annotations should be the same. In following we first introduce the concatenation of heatmaps and later we will show how to concatenate heatmaps with annotations.
In following example, there are three matrices where the third heatmap is a vector and it will be transformed as a one-column matrix. The one-column heatmap is sometimes useful when you concatenate a list of heatmaps that it can show e.g. annotations for each row or some scores of each row. E.g. if rows are genes, the type of the genes (i.e. protein coding or not) can be represented as a one-column character matrix, and the p-value or the fold change from differential expression analysis can be represented as a one-column numeric matrix, and be concatenated to the main expression heatmap.
set.seed(123)
mat1 = matrix(rnorm(80, 2), 8, 10)
mat1 = rbind(mat1, matrix(rnorm(40, -2), 4, 10))
rownames(mat1) = paste0("R", 1:12)
colnames(mat1) = paste0("C", 1:10)

mat2 = matrix(runif(60, max = 3, min = 1), 6, 10)
mat2 = rbind(mat2, matrix(runif(60, max = 2, min = 0), 6, 10))
rownames(mat2) = paste0("R", 1:12)
colnames(mat2) = paste0("C", 1:10)

le = sample(letters[1:3], 12, replace = TRUE)
names(le) = paste0("R", 1:12)

ind = sample(12, 12)
mat1 = mat1[ind, ]
mat2 = mat2[ind, ]
le = le[ind]
To concatenate heatmaps, simply use + operator.
ht1 = Heatmap(mat1, name = "rnorm")
ht2 = Heatmap(mat2, name = "runif")
ht3 = Heatmap(le, name = "letters")

ht1 + ht2 + ht3
Under default mode, dendrograms from the second heatmap will be removed and row orders will be the same as the first one. Also row names for the first two heatmaps are removed as well.
The returned value of the concatenation is a HeatmapList object. Similar as
explained in Section 2.11, directly printing ht_list will
call draw() method with default settings. With explicitly calling draw()
method, you can have more controls on the heatmap list.
ht_list = ht1 + ht2 + ht3
class(ht_list)
## [1] "HeatmapList"
## attr(,"package")
## [1] "ComplexHeatmap"You can append any number of heatmaps to the heatmap list. Also you can append a heatmap list to a heatmap list.
# code only for demonstration
ht1 + ht_list
ht_list + ht1
ht_list + ht_list
NULL can be added to the heatmap list. It would be convinient when users
want to construct a heatmap list through a for loop.
# code only for demonstration
ht_list = NULL  ## Heatmap(...) + NULL gives you a HeatmapList object
for(s in sth) {
    ht_list = ht_list + Heatmap(...)
}
You can also add heatmap annotations to the heatmap list, see more details in Section 4.7.
4.1 Titles
A heatmap list also has title which is like a global title covering all
heatmaps. row_title and column_title should be set in the draw()
function.
From following example, we set different colors for each heatmap to make them distinguishable.
col_rnorm = colorRamp2(c(-3, 0, 3), c("green", "white", "red"))
col_runif = colorRamp2(c(0, 3), c("white", "orange"))
col_letters = c("a" = "pink", "b" = "purple", "c" = "blue")
ht1 = Heatmap(mat1, name = "rnorm", col = col_rnorm,
    row_title = "Heatmap 1", column_title = "Heatmap 1")
ht2 = Heatmap(mat2, name = "runif", col = col_runif,
    row_title = "Heatmap 2", column_title = "Heatmap 2")
ht3 = Heatmap(le, name = "letters", col = col_letters)
ht_list = ht1 + ht2 + ht3

draw(ht_list, row_title = "Three heatmaps, row title", row_title_gp = gpar(col = "red"),
    column_title = "Three heatmaps, column title", column_title_gp = gpar(fontsize = 16))
You can use gt_render() to construct complicated text, see Section 10.3.
4.2 Size of heatmaps
The width for some heatmaps can be set to absolute units. Note width
controls the width of the heatmap body.
ht2 = Heatmap(mat2, name = "runif", col = col_runif, width = unit(4, "cm"))
ht3 = Heatmap(le, name = "letters", col = col_letters, width = unit(5, "mm"))
ht1 + ht2 + ht3
The width of all heatmaps can be set as absolute units.
ht1 = Heatmap(mat1, name = "rnorm", col = col_rnorm, width = unit(4, "cm"))
ht2 = Heatmap(mat2, name = "runif", col = col_runif, width = unit(6, "cm"))
ht3 = Heatmap(le, name = "letters", col = col_letters, width = unit(1, "cm"))
ht1 + ht2 + ht3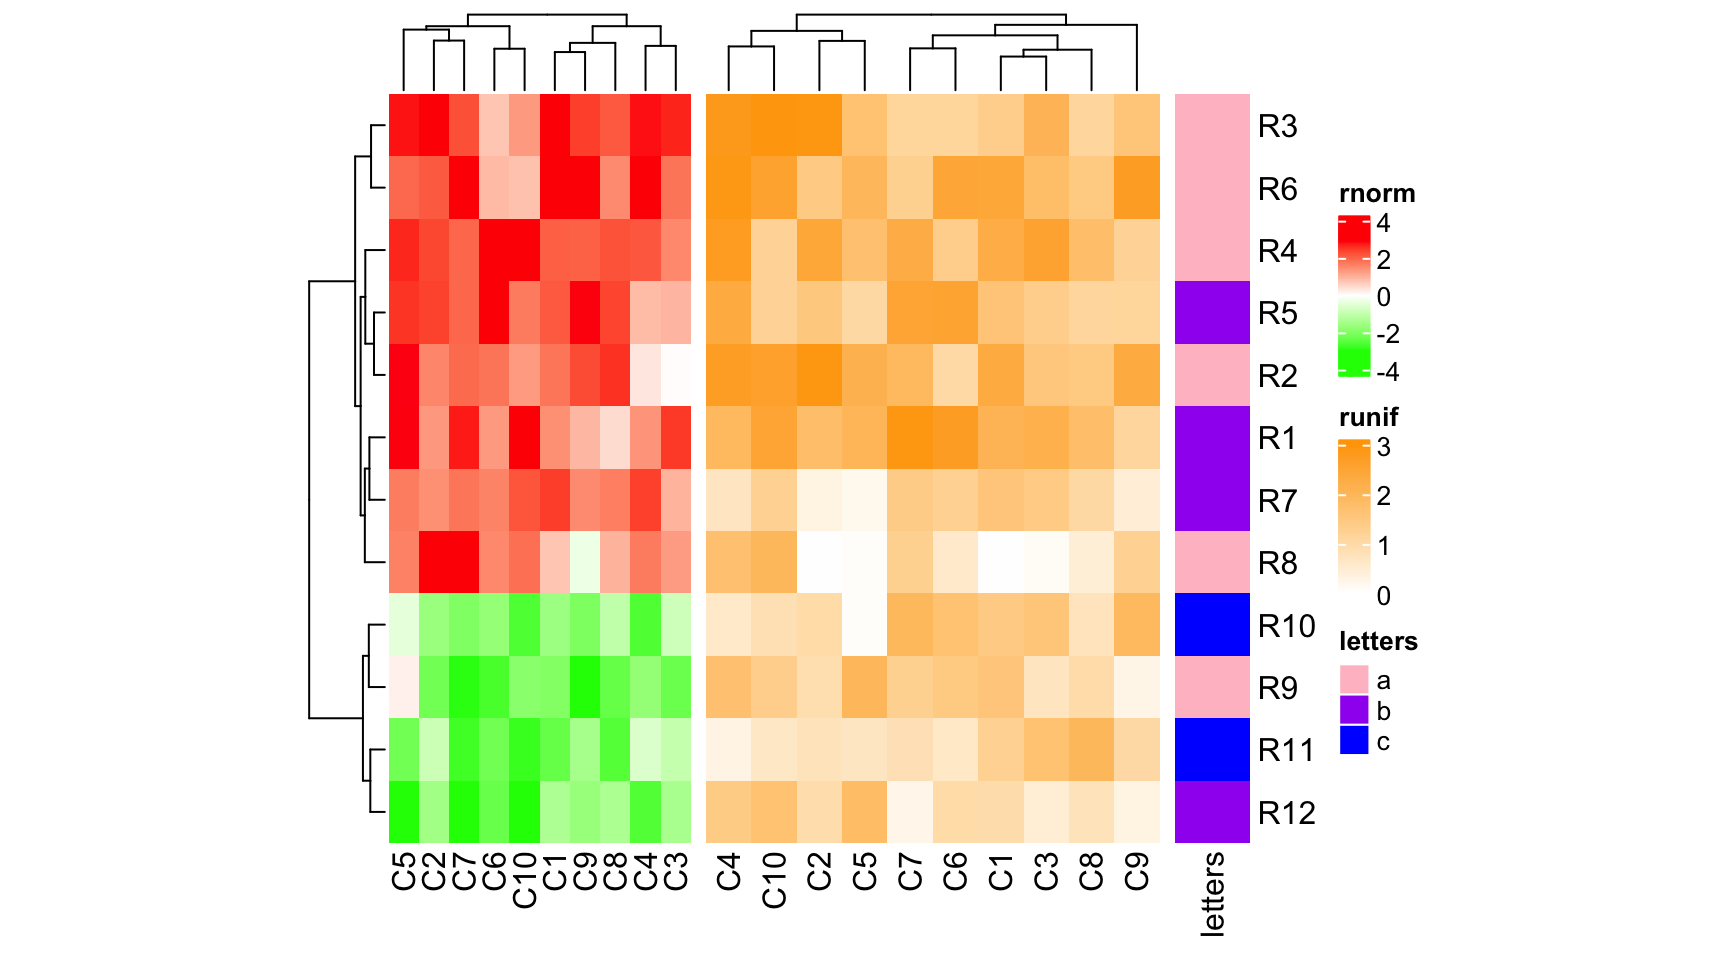
If width is numeric, it is converted as a null unit.
ht1 = Heatmap(mat1, name = "rnorm", col = col_rnorm, width = 6)
ht2 = Heatmap(mat2, name = "runif", col = col_runif, width = 4)
ht3 = Heatmap(le, name = "letters", col = col_letters, width = 1)
ht1 + ht2 + ht3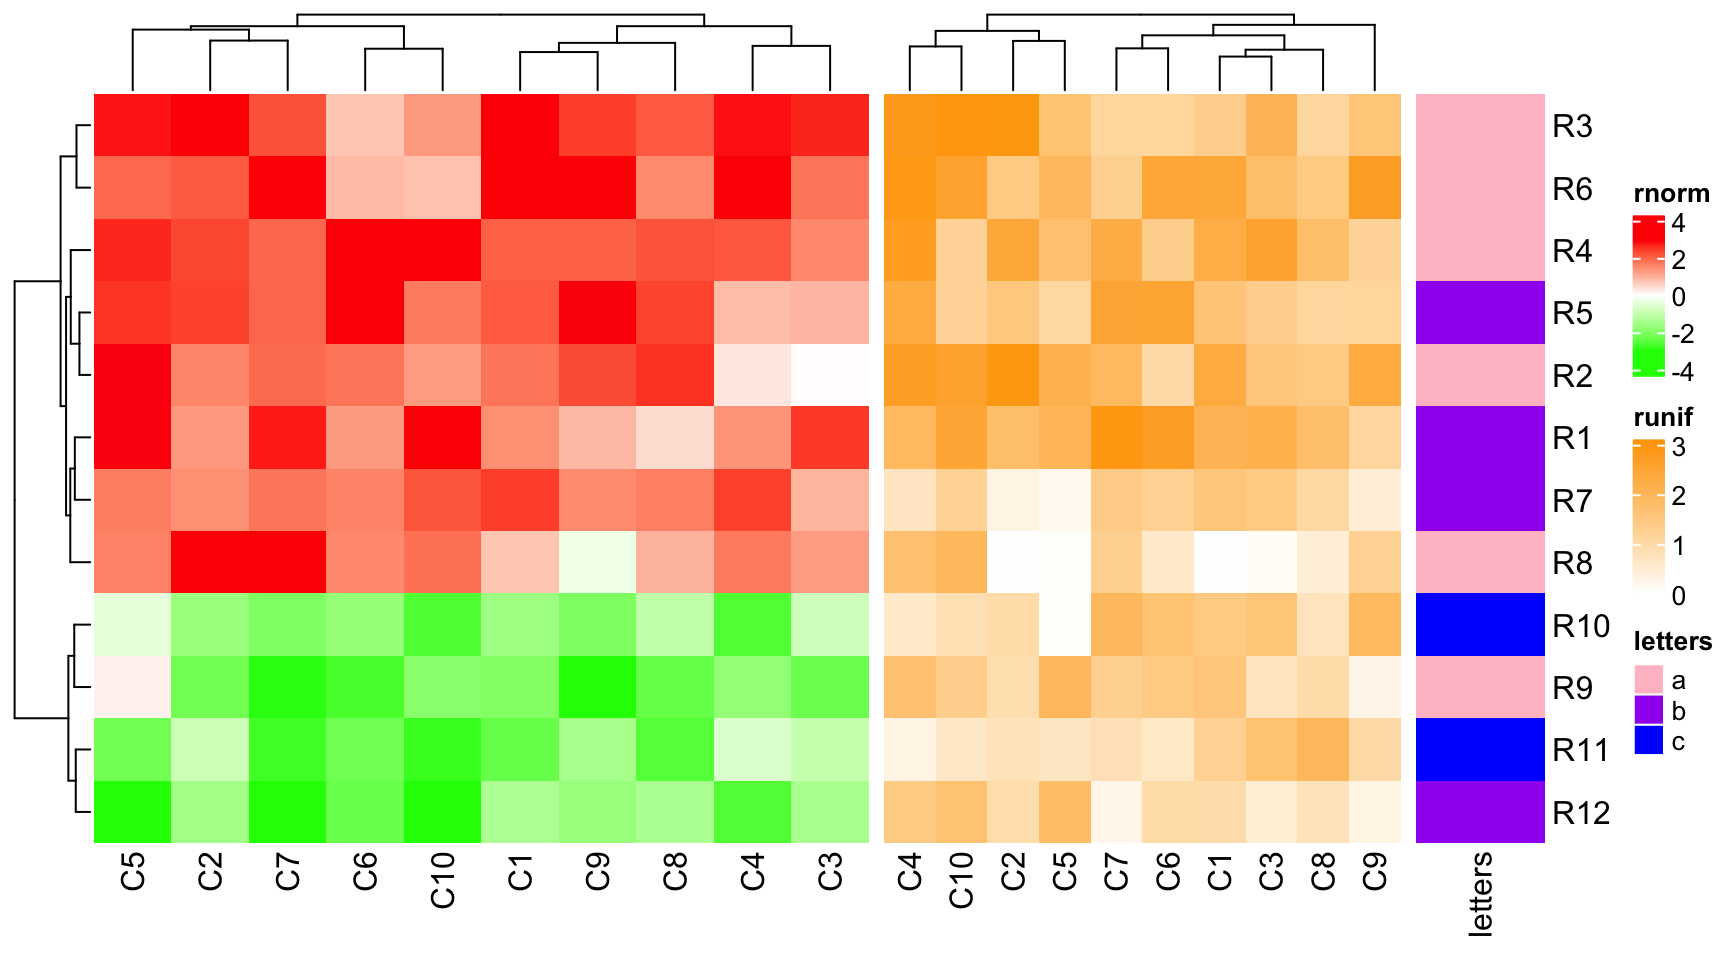
heatmap_width also can control the width of the heatmap, but it is the total
width of the heatmap body plus the heatmap components.
4.3 Gap between heatmaps
ht_gap controls the space between heatmaps. The value can be a single unit
or a vector of units.
ht1 = Heatmap(mat1, name = "rnorm", col = col_rnorm)
ht2 = Heatmap(mat2, name = "runif", col = col_runif)
ht3 = Heatmap(le, name = "letters", col = col_letters)
ht_list = ht1 + ht2 + ht3
draw(ht_list, ht_gap = unit(1, "cm"))
draw(ht_list, ht_gap = unit(c(3, 10), "mm"))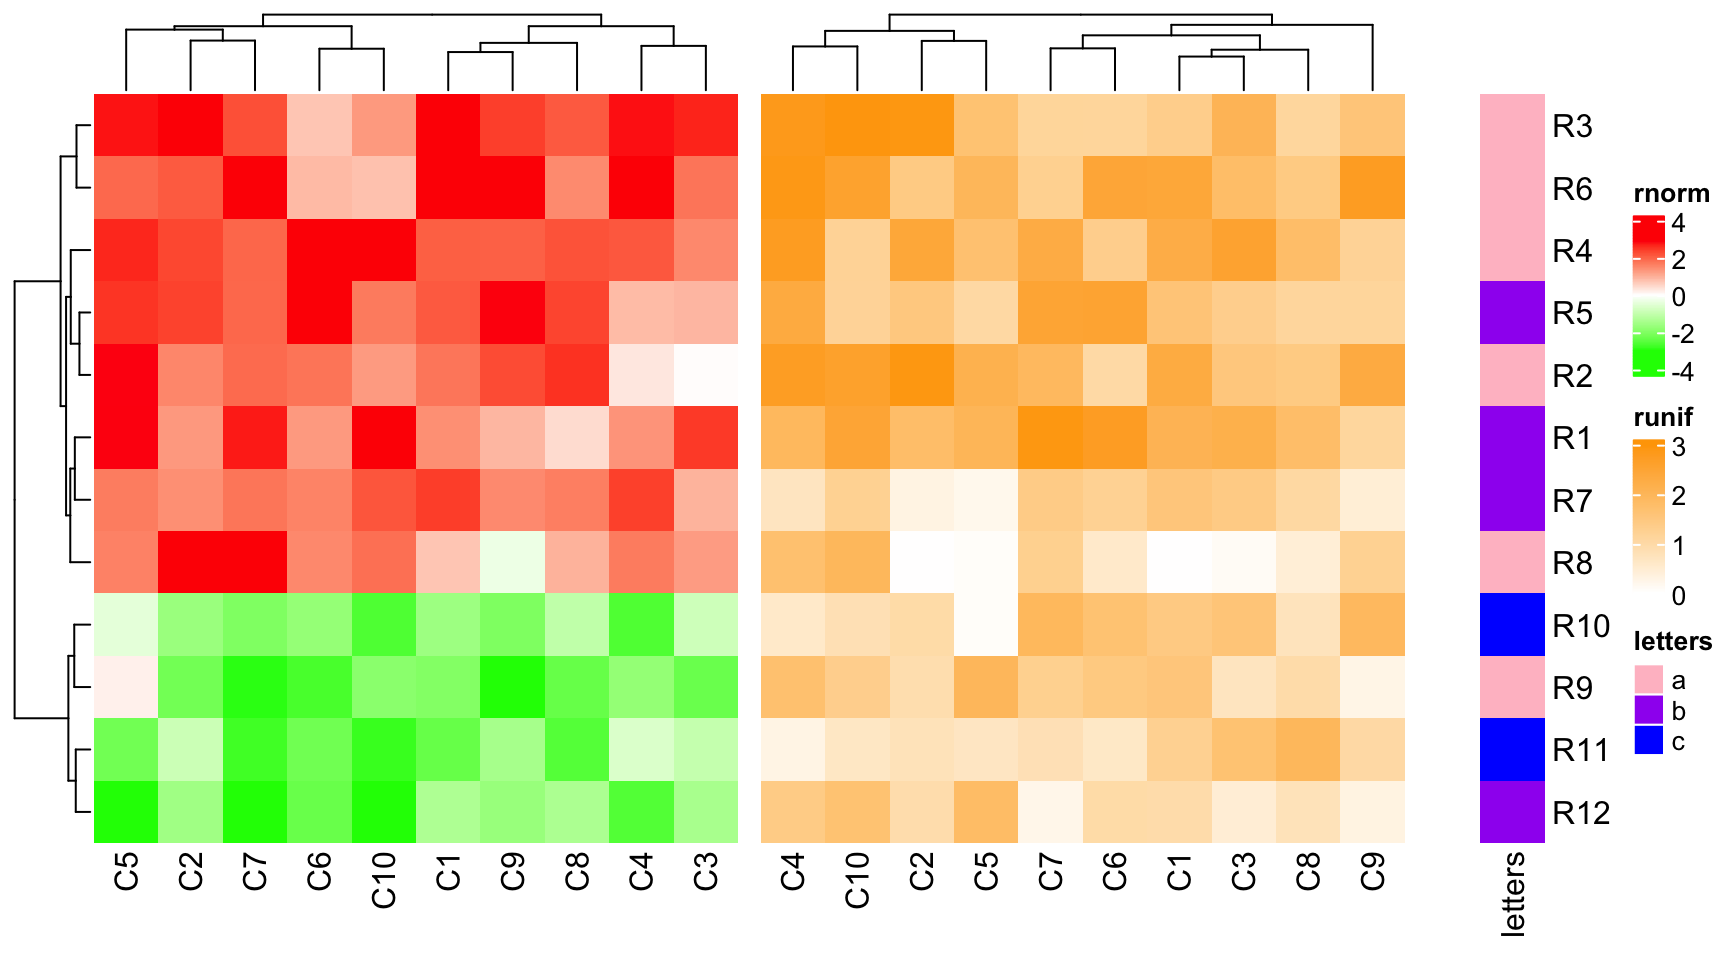
4.4 Automatic adjustment to the main heatmap
There is always a main heatmap in the heatmap list that controls the global row ordering. All the other heatmaps are automatically adjusted according to the settings in the main heatmap. For these non-main heatmaps, the adjustments are:
- No row clustering is performed and they all take the row ordering of the main heatmap.
- Row titles are removed.
- If the main heatmap is split by rows, all other heatmaps will also be split by same levels as the main heatmap.
- The height of the main heatmap are taken as the height of all heatmaps.
By default, the first heatmap is taken as the main heatmap.
ht1 = Heatmap(mat1, name = "rnorm", col = col_rnorm, row_km = 2)
ht2 = Heatmap(mat2, name = "runif", col = col_runif)
ht3 = Heatmap(le, name = "letters", col = col_letters)
ht2 + ht1 + ht3 # ht2 is the main heatmap and row_km in ht1 is ignored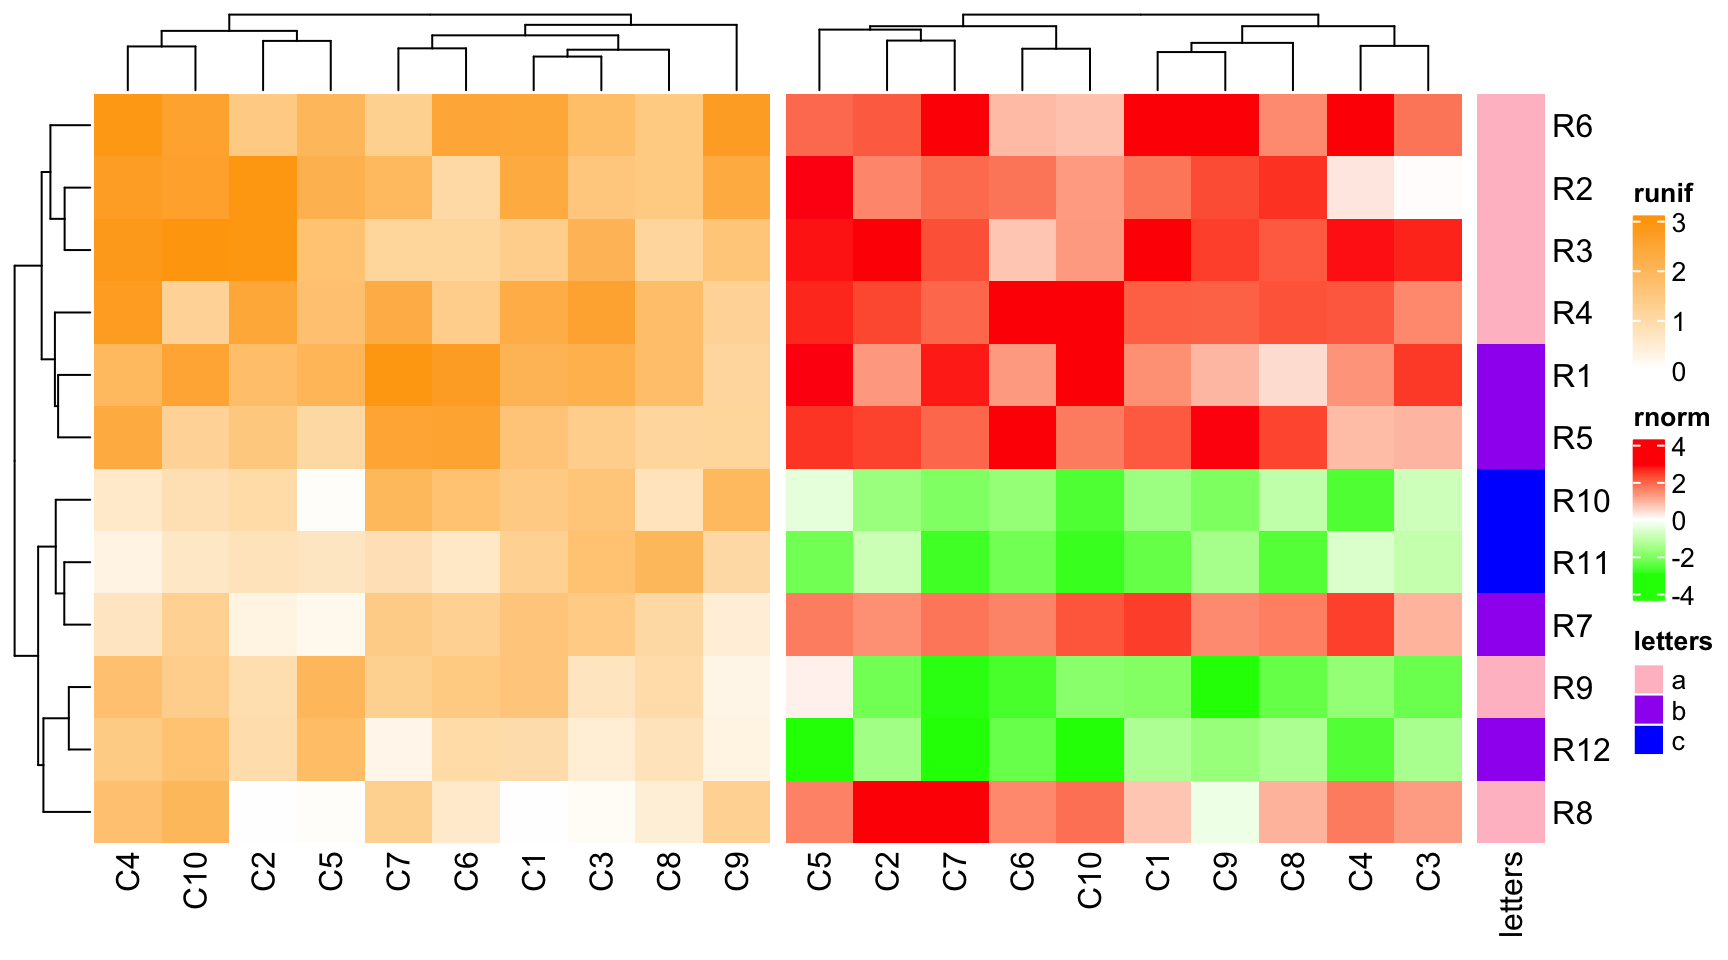
The main heatmap can be specified by main_heatmap argument. The value can be
a numeric index or the name of the heatmap (of course, you need to set the
heatmap name when you create the Heatmap object). In following example,
although ht1 is the second heatmap, we can set it as the main heatmap.
ht_list = ht2 + ht1 + ht3
draw(ht_list, main_heatmap = "rnorm")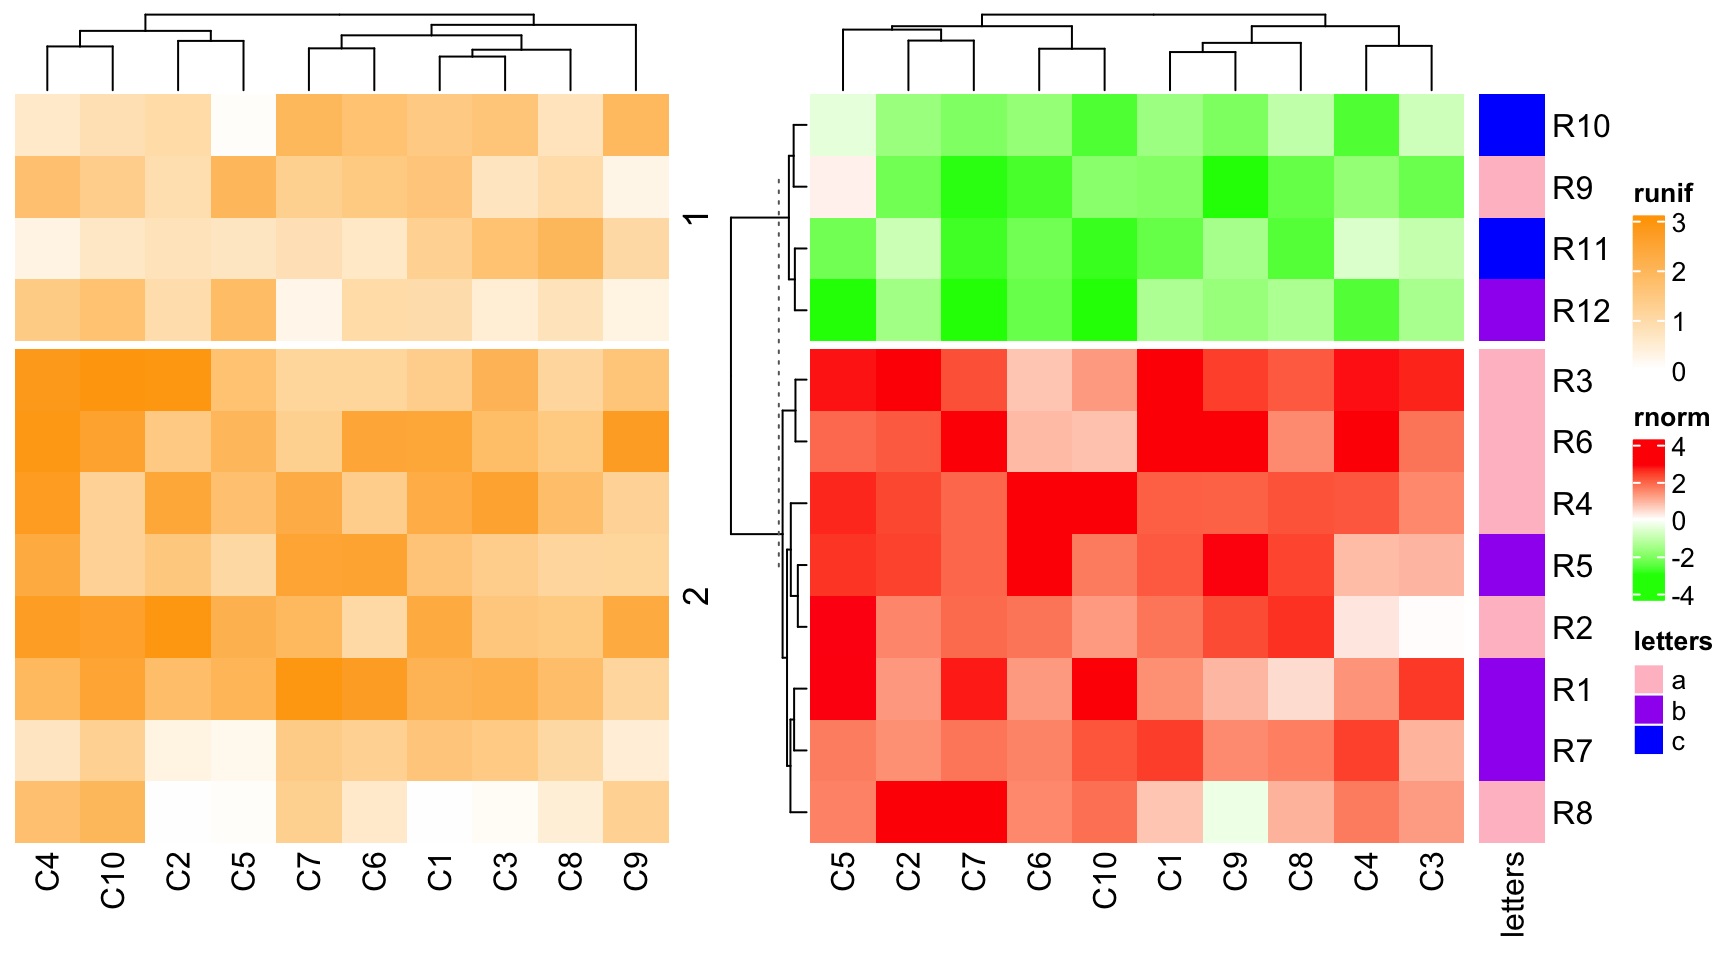
By default, the dendrogram and the row title are plotted just beside the main
heatmap, just to emphasize the clustering or the splitting is calculated from
the main heatmap while not other heatmaps. However, the position of the
dendrogram and row title of the main heatmap can be controlled by
row_dend_side and row_sub_title_side in draw() function.
ht_list = ht2 + ht1 + ht3
draw(ht_list, main_heatmap = "rnorm", row_dend_side = "right", row_sub_title_side = "left")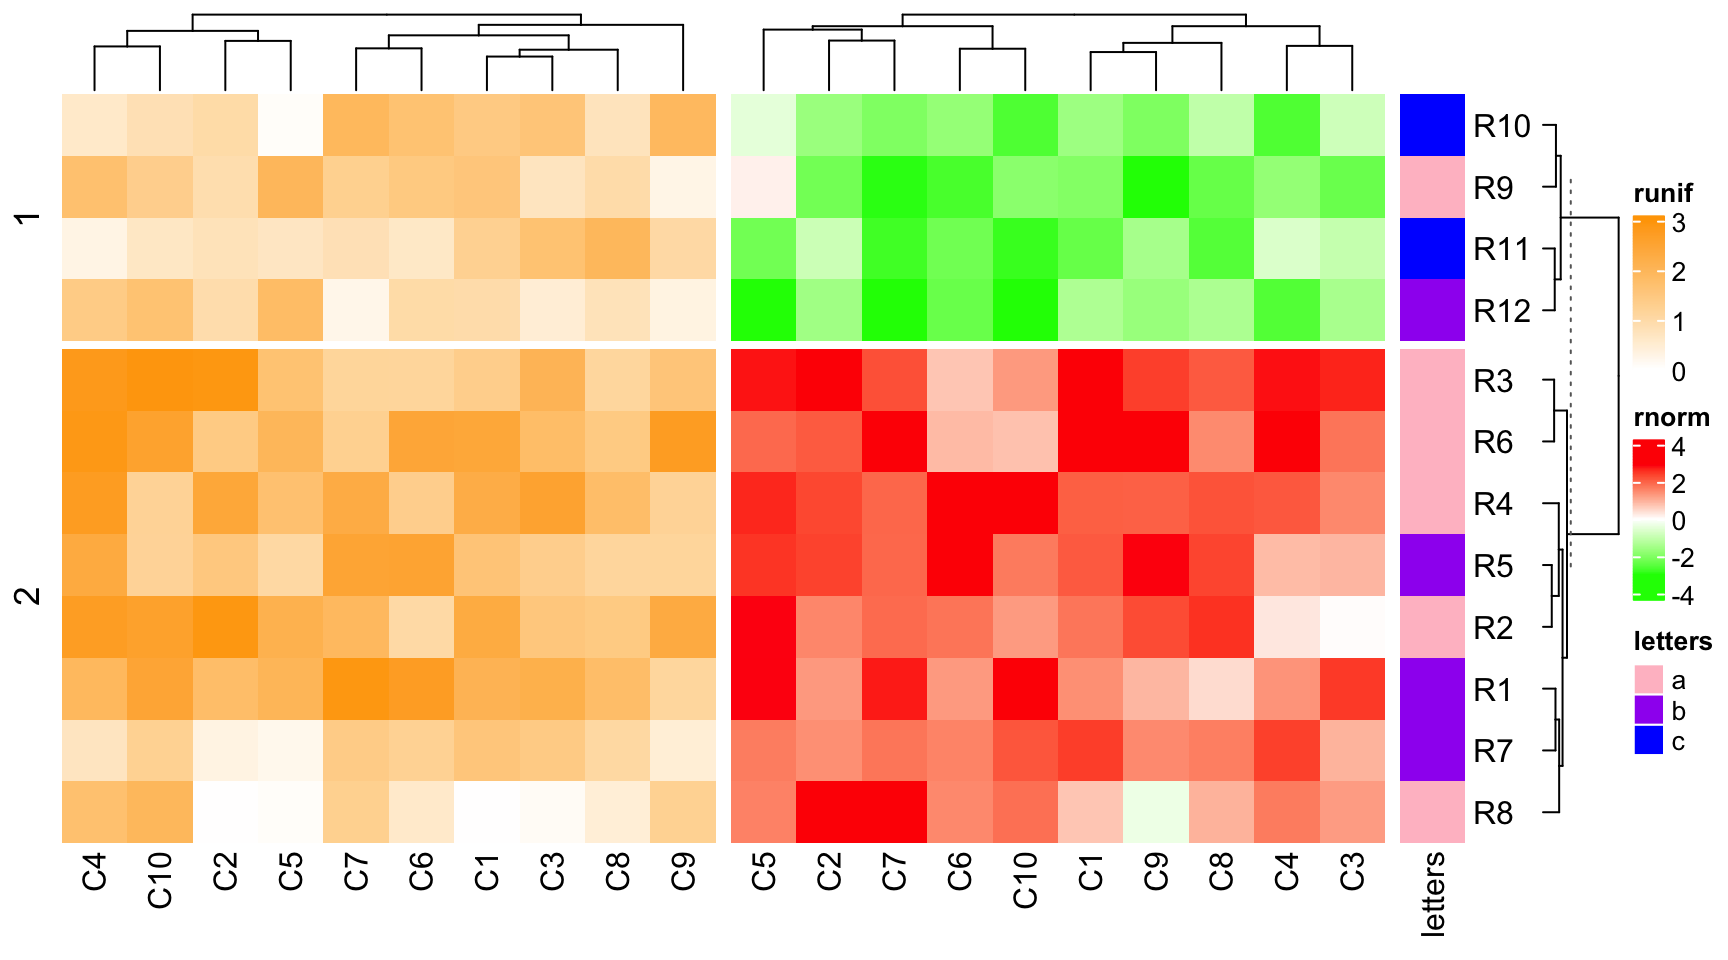
Similarly, if there is no row clustering in the main heatmap, all other heatmaps are not clustered neither.
ht1 = Heatmap(mat1, name = "rnorm", col = col_rnorm, cluster_rows = FALSE)
ht2 = Heatmap(mat2, name = "runif", col = col_runif)
ht3 = Heatmap(le, name = "letters", col = col_letters)
ht1 + ht2 + ht3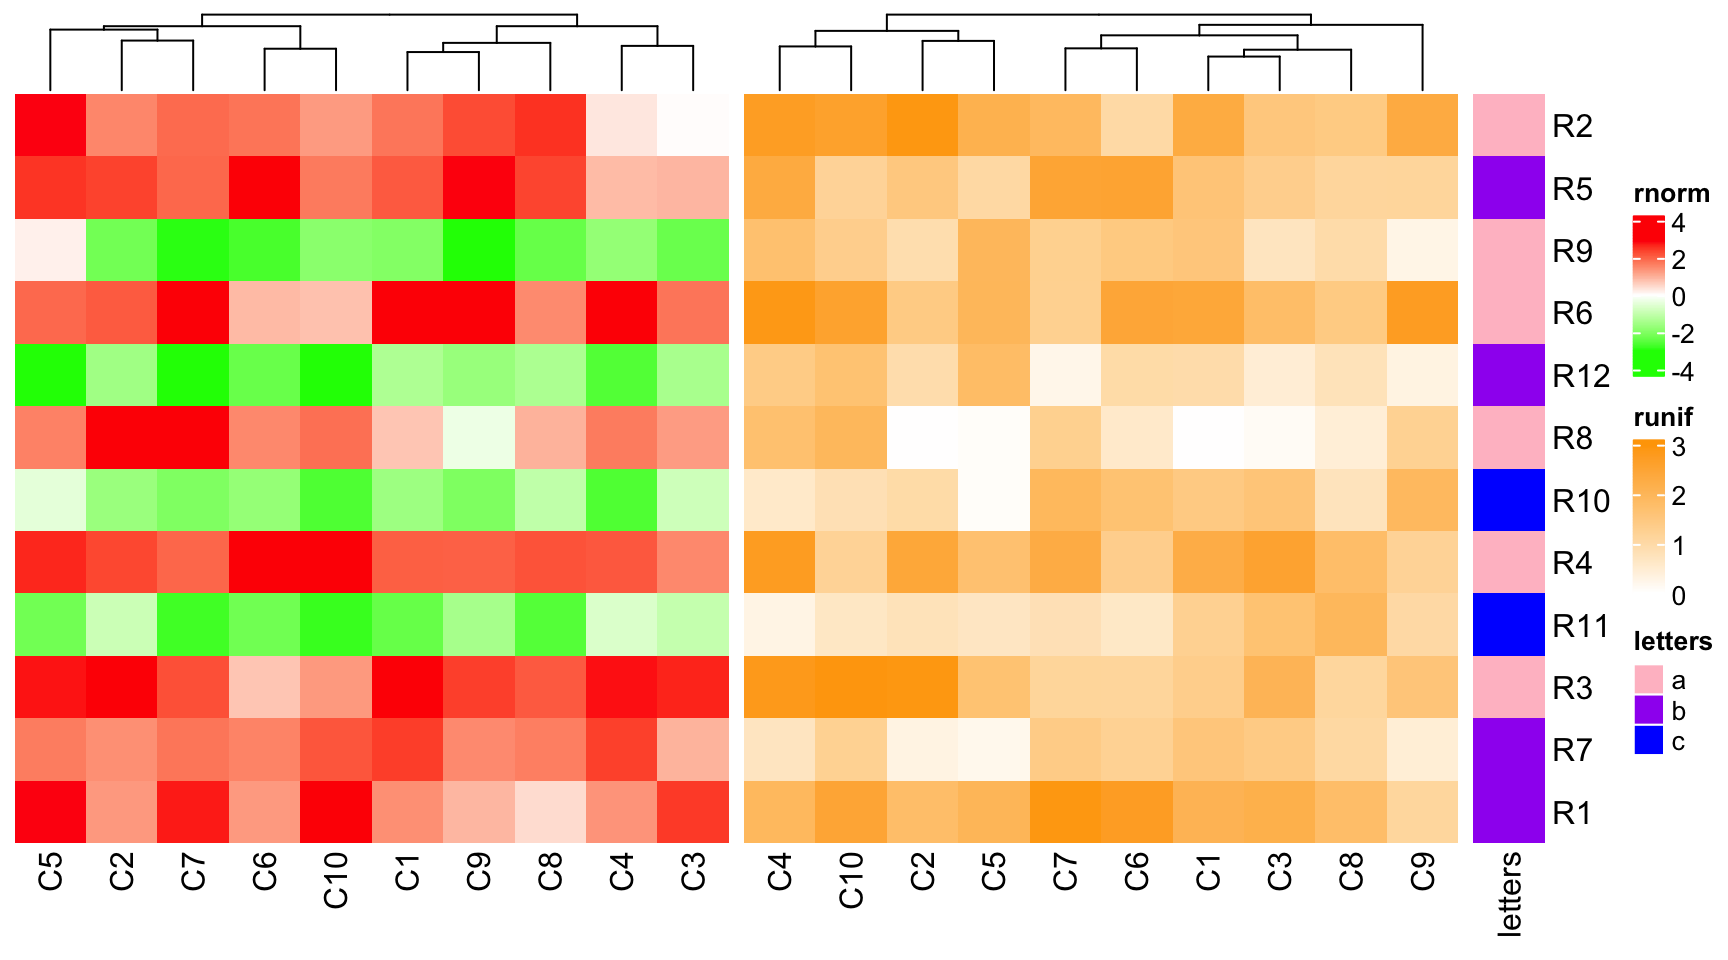
As you may have observed, all the row names between heatmaps are removed from
the plot. You can show them by setting auto_adjust = FALSE.
ht1 = Heatmap(mat1, name = "rnorm", col = col_rnorm)
ht2 = Heatmap(mat2, name = "runif", col = col_runif)
ht3 = Heatmap(le, name = "letters", col = col_letters)
ht_list = ht1 + ht2 + ht3
draw(ht_list, auto_adjust = FALSE)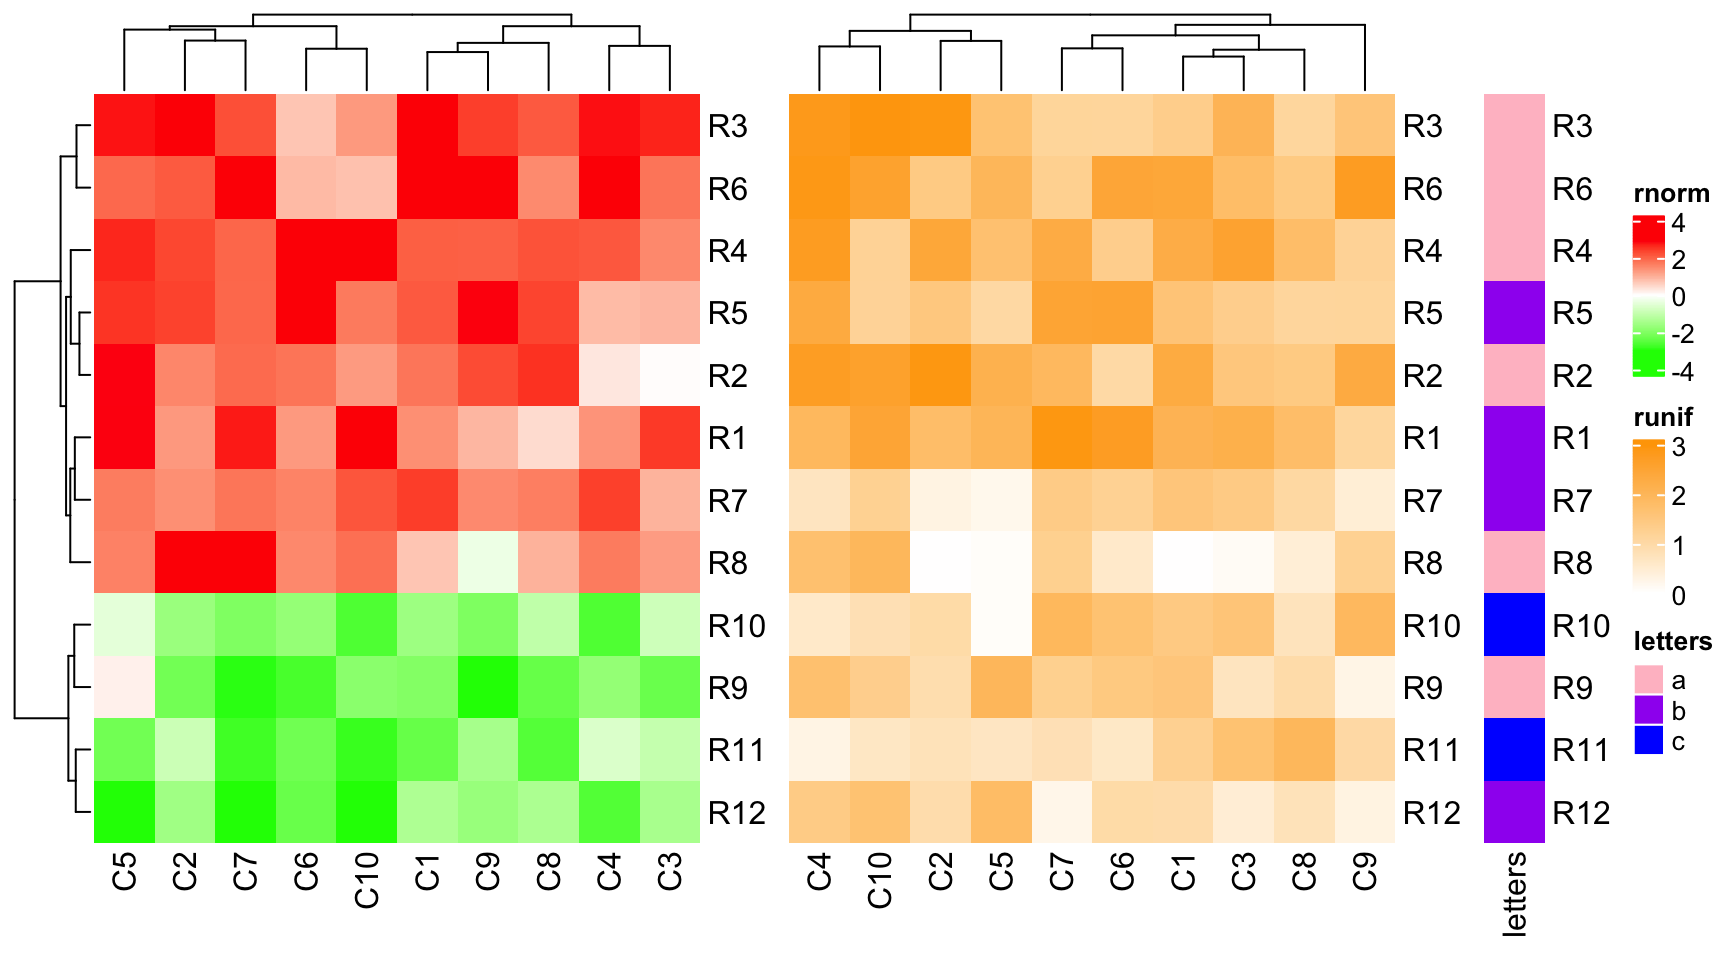
4.5 Control main heatmap in draw() function
Settings of the main heatmap can be controlled in the main Heatmap()
function. To make it convinient, settings that affect heatmap rows can also be
directly set in draw(). If some of these settings are set, corresponding
settings in the main Heatmap() will be overwritten.
In draw() function, following main heatmap settings control row orders of
all heatmaps.
cluster_rowsclustering_distance_rowsclustering_method_rowsrow_dend_widthshow_row_dendrow_dend_reorderrow_dend_gprow_order
Following settings control the row slices.
row_gaprow_kmrow_km_repeatsrow_split
Following settings control the heatmap height.
heightheatmap_height
In following example, row_km = 2, cluster_rows = FALSE for ht1 is
overwritten in draw().
ht1 = Heatmap(mat1, name = "rnorm", col = col_rnorm, row_km = 2, cluster_rows = FALSE)
ht2 = Heatmap(mat2, name = "runif", col = col_runif)
ht3 = Heatmap(le, name = "letters", col = col_letters)
ht_list = ht1 + ht2 + ht3
draw(ht_list, row_km = 1, row_split = le, cluster_rows = TRUE)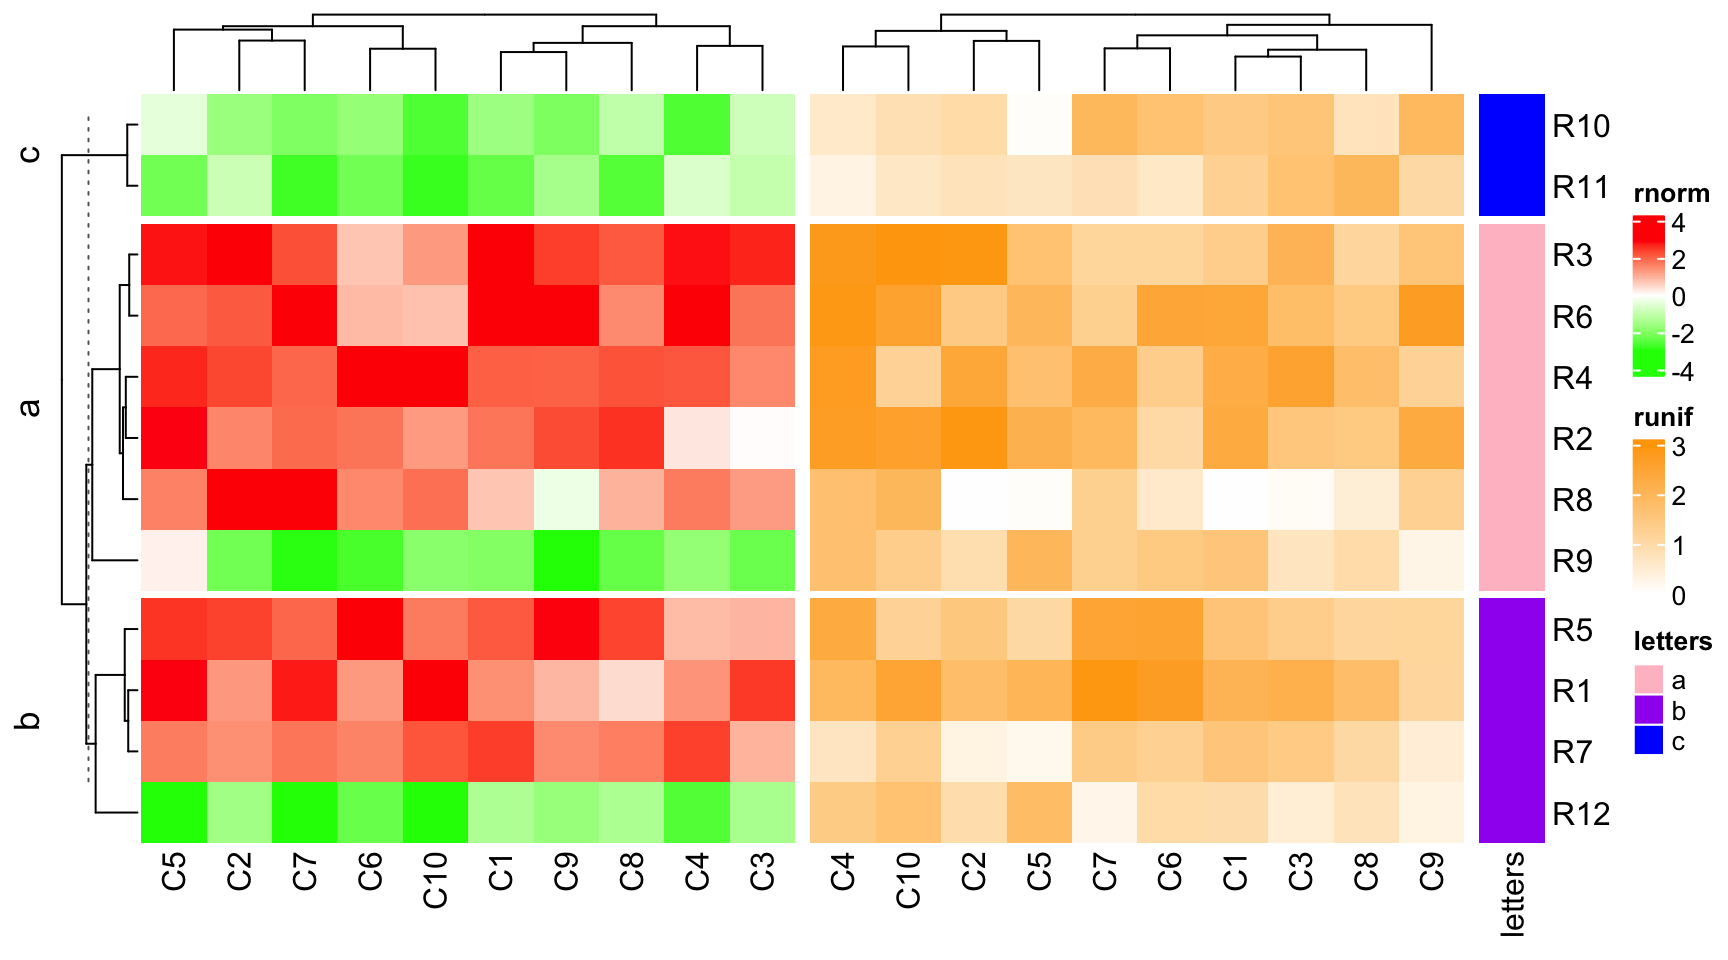
4.6 Annotations as components are adjusted
If some of the heatmaps in the heatmap list have annotations, in most of the cases, the heights of the heatmap annotations are different for different heatmaps. There are automatic adjustment for heatmap annotations, and this adjustment will also involve adjustment of dendrograms.
Normally, the size of simple annotations will not change in the adjustment. In
following example, the dendrogram for the second heatmap is adjusted. Note you
still can change the size of simple annotation by setting anno_simple_size
in HeatmapAnnotation() or globally set ht_opt$anno_simple_size.
ha1 = HeatmapAnnotation(foo1 = 1:10, annotation_name_side = "left")
ht1 = Heatmap(mat1, name = "rnorm", col = col_rnorm, top_annotation = ha1)
ht2 = Heatmap(mat2, name = "runif", col = col_runif)
ht3 = Heatmap(le, name = "letters", col = col_letters)
ht1 + ht2 + ht3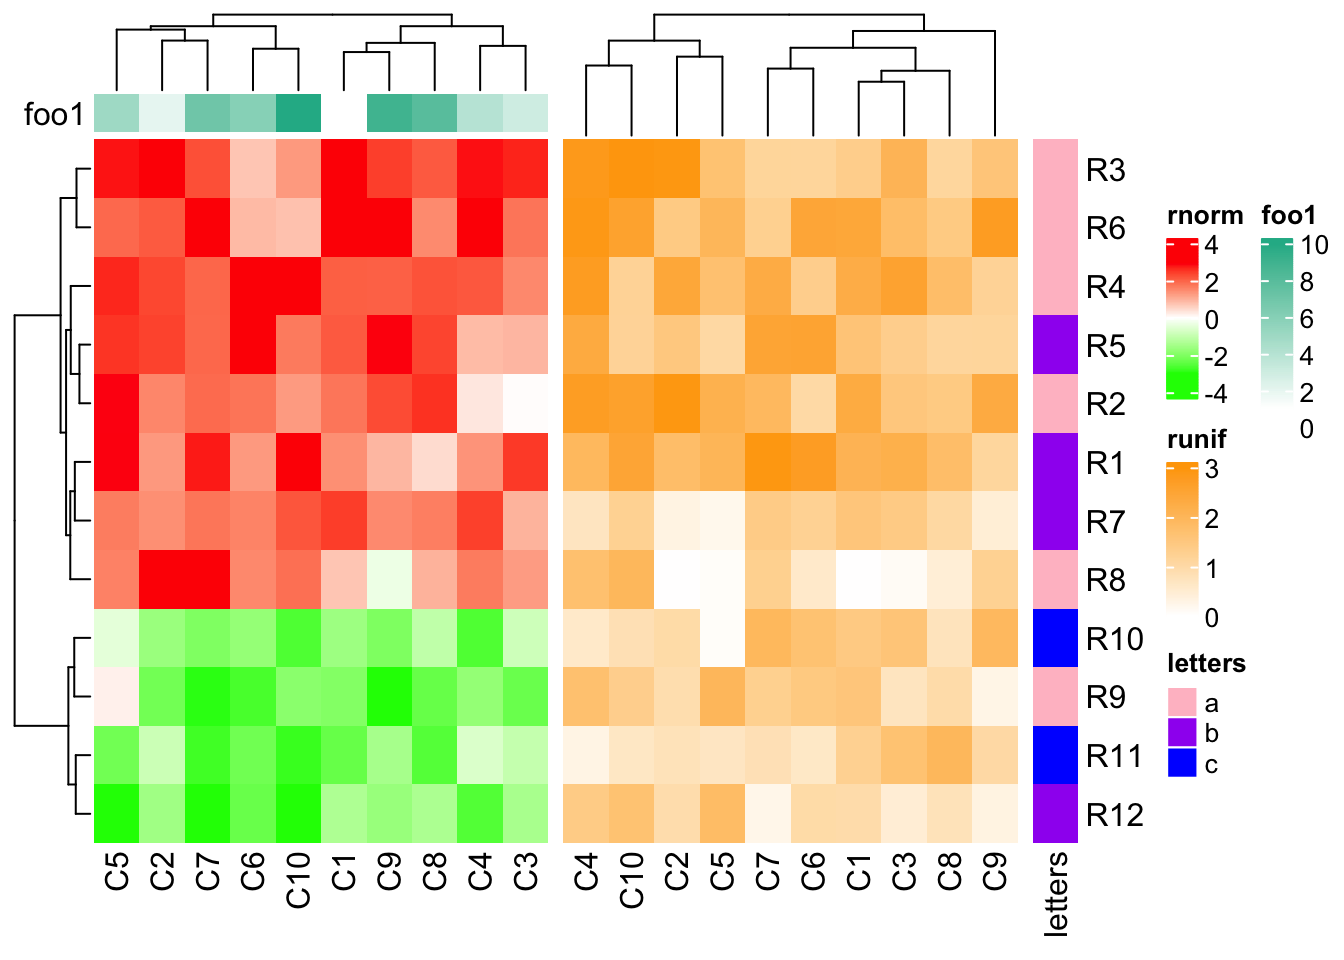
If the first two heatmaps all have annotations, since the size of simple annotations keep unchanged, the size of complex annotations will be adjusted to make the total heights of the two heatmap annotations the same.
ha1 = HeatmapAnnotation(foo1 = 1:10, bar1 = anno_points(1:10),
    annotation_name_side = "left")
ha2 = HeatmapAnnotation(bar2 = anno_barplot(1:10))
ht1 = Heatmap(mat1, name = "rnorm", col = col_rnorm, top_annotation = ha1)
ht2 = Heatmap(mat2, name = "runif", col = col_runif, top_annotation = ha2)
ht3 = Heatmap(le, name = "letters", col = col_letters)
ht_list = ht1 + ht2 + ht3
draw(ht_list, ht_gap = unit(c(6, 2), "mm"))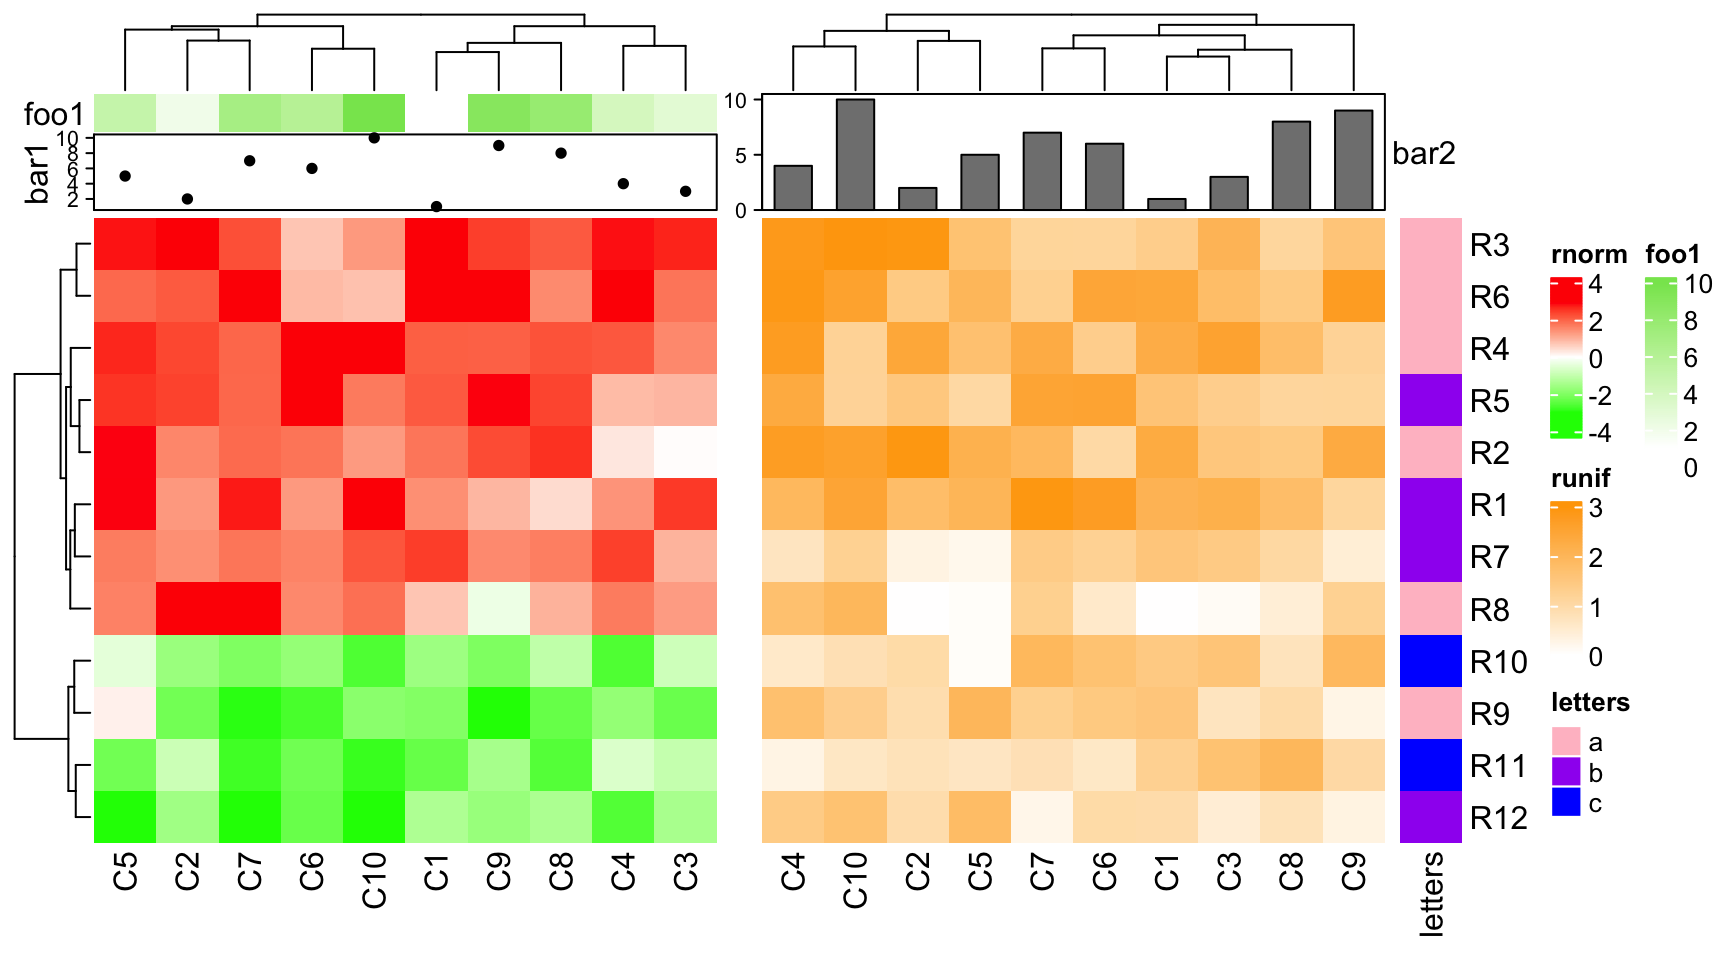
Similarly, if the first heatmap only contains simple annotatins, dendrogram will be adjusted.
ha1 = HeatmapAnnotation(foo1 = 1:10, annotation_name_side = "left")
ha2 = HeatmapAnnotation(bar2 = anno_barplot(1:10, height = unit(2, "cm")))
ht1 = Heatmap(mat1, name = "rnorm", col = col_rnorm, top_annotation = ha1)
ht2 = Heatmap(mat2, name = "runif", col = col_runif, top_annotation = ha2)
ht3 = Heatmap(le, name = "letters", col = col_letters)
ht_list = ht1 + ht2 + ht3
draw(ht_list, ht_gap = unit(c(6, 2), "mm"))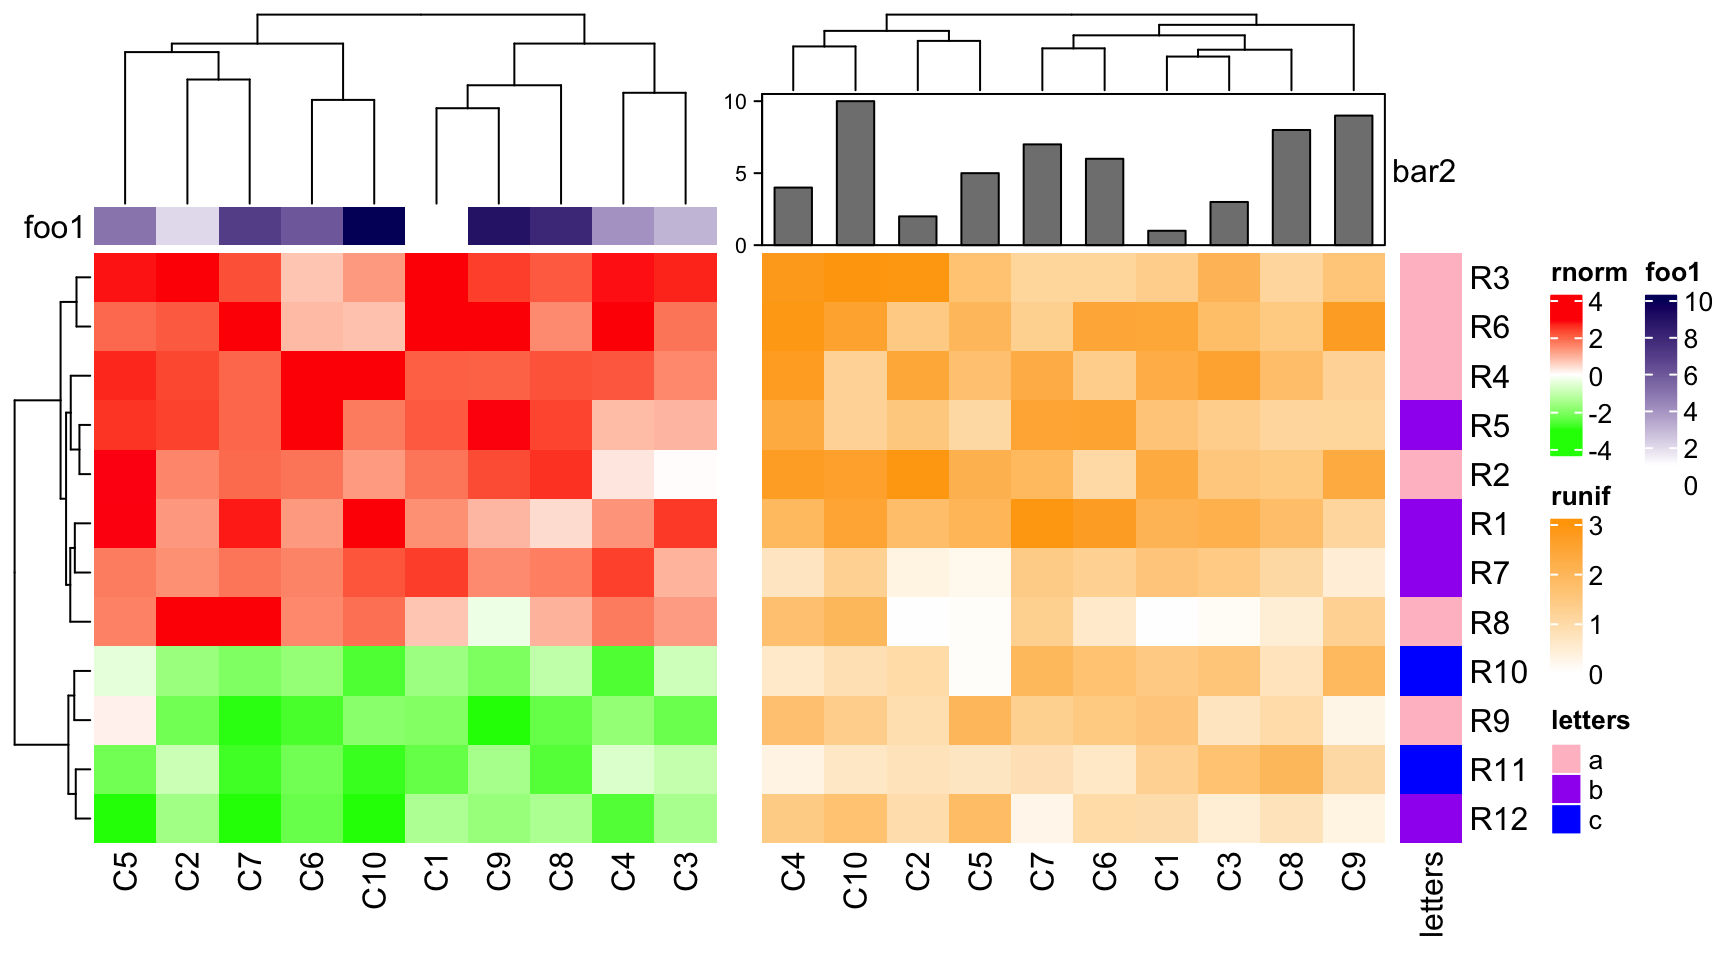
If the both heatmaps only contain simple annotations but with unequal number, dendrogram will be adjusted.
ha1 = HeatmapAnnotation(foo1 = 1:10, annotation_name_side = "left")
ha2 = HeatmapAnnotation(bar2 = cbind(b1 = 1:10, b2 = 11:20, b3 = 21:30))
ht1 = Heatmap(mat1, name = "rnorm", col = col_rnorm, top_annotation = ha1)
ht2 = Heatmap(mat2, name = "runif", col = col_runif, top_annotation = ha2)
ht3 = Heatmap(le, name = "letters", col = col_letters)
ht_list = ht1 + ht2 + ht3
draw(ht_list)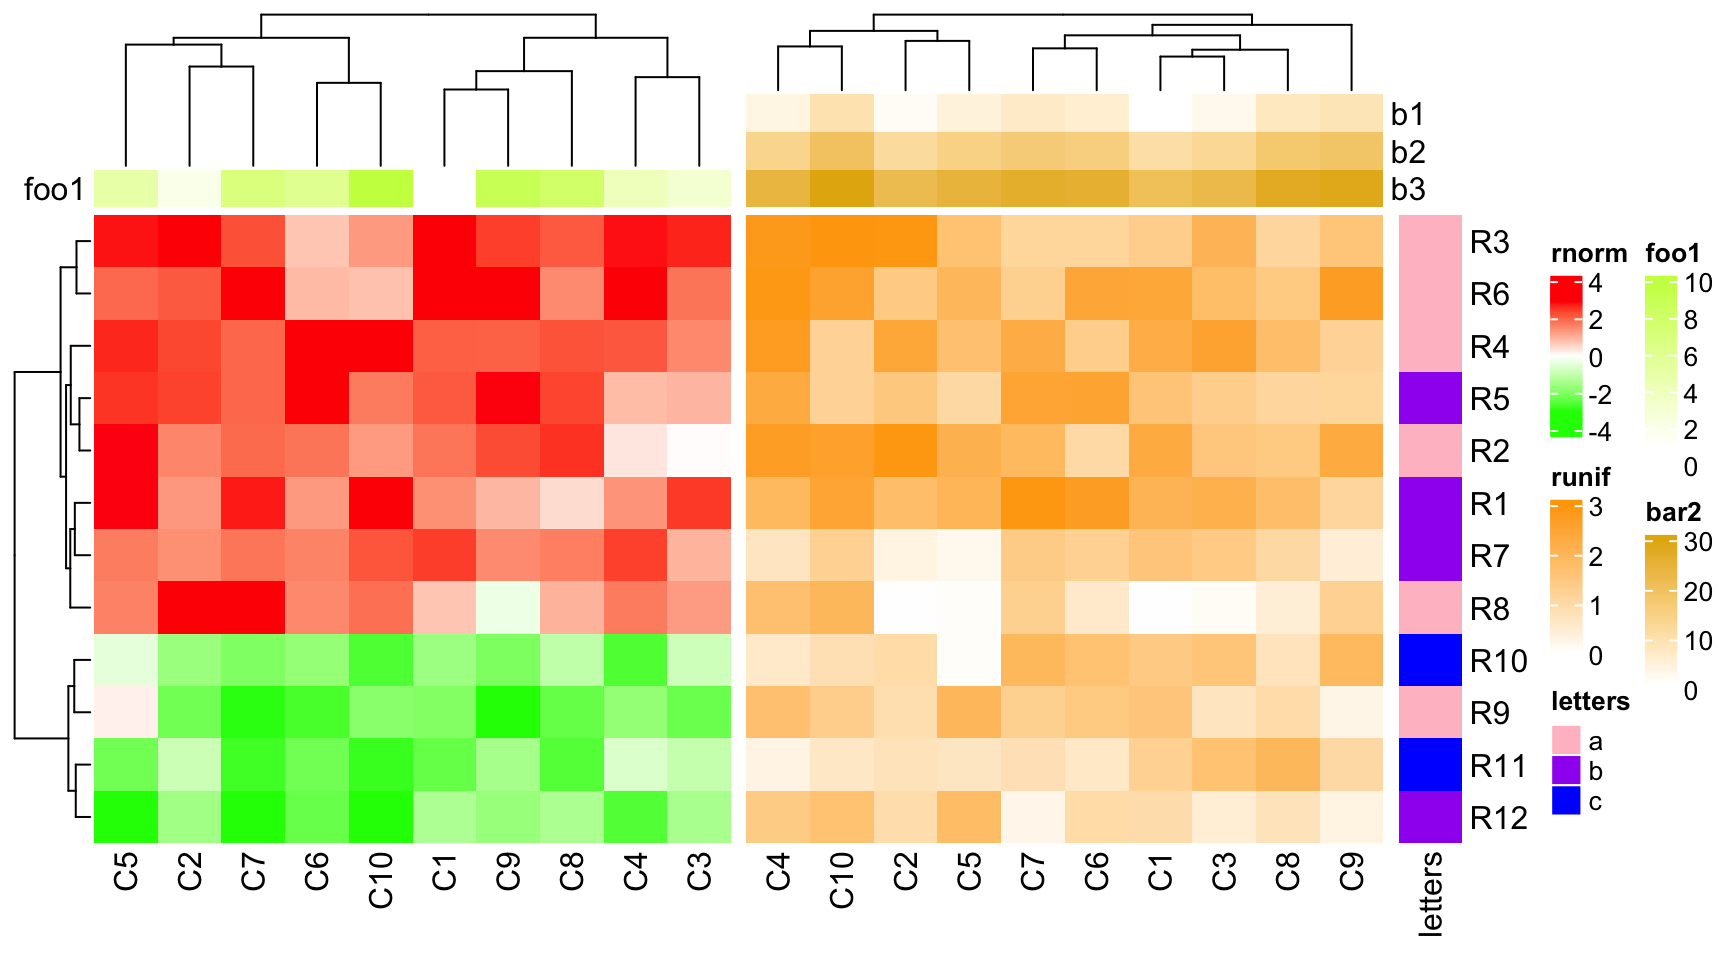
If you also want to automatically adjust the size of simple annotations, set
simple_anno_size_adjust = TRUE in every HeatmapAnnotation() calls.
If the second heatmap has no bottom annotation, column names for the second heatmap are adjusted to be put directly below the heatmap body.
ha1 = HeatmapAnnotation(foo1 = 1:10, bar1 = anno_points(1:10), annotation_name_side = "left")
ht1 = Heatmap(mat1, name = "rnorm", col = col_rnorm, bottom_annotation = ha1)
ht2 = Heatmap(mat2, name = "runif", col = col_runif)
ht3 = Heatmap(le, name = "letters", col = col_letters)
ht_list = ht1 + ht2 + ht3
draw(ht_list)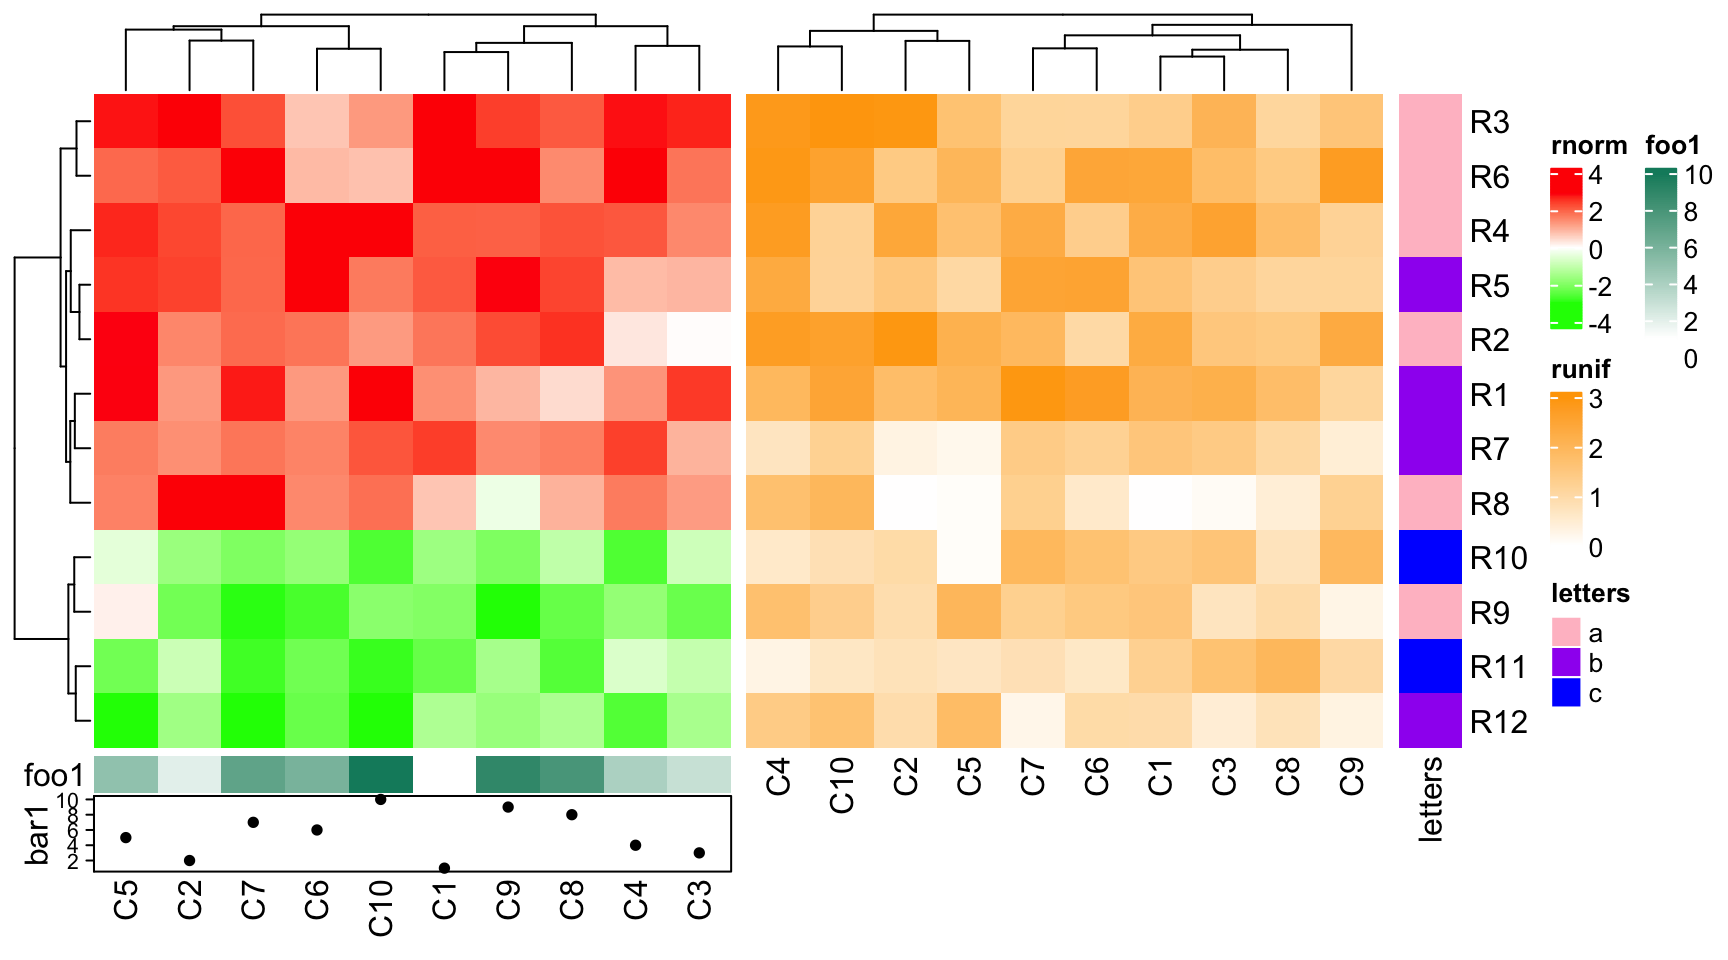
4.7 Concatenate with annotations
Row annotations can be concatenated to the horizontal heatmap list, while not only a component of the heatmap. See following examples which are very straightforward.
ha1 = rowAnnotation(foo = 1:12, bar = anno_barplot(1:12, width = unit(4, "cm")))
ht1 = Heatmap(mat1, name = "rnorm", col = col_rnorm, row_km = 2)
ht1 + ha1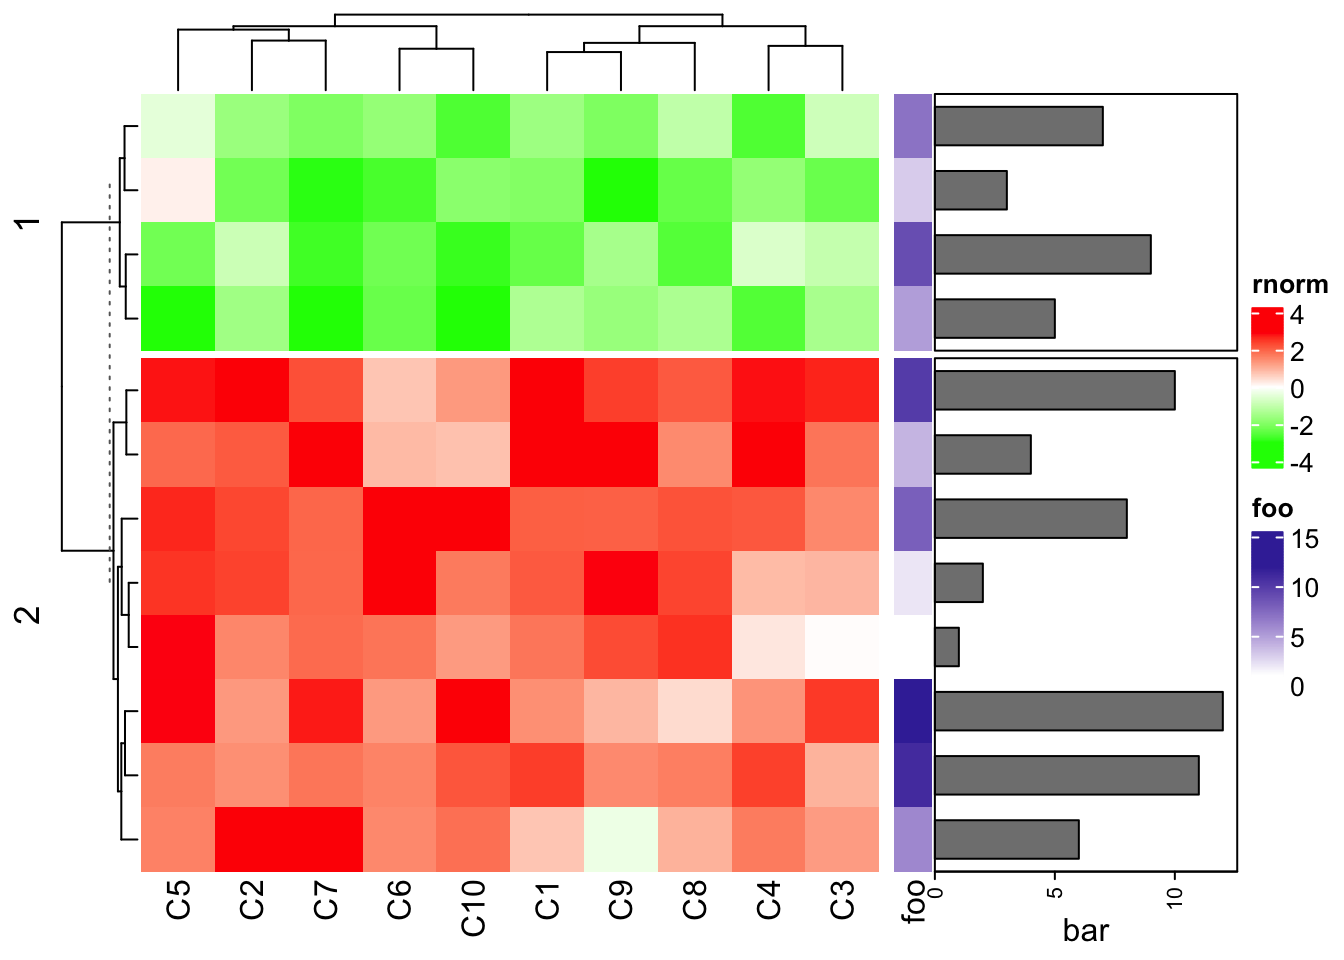
The foo and bar annotations can be defined in two separated
rowAnnotation() calls.
Heatmap(mat1, name = "rnorm", col = col_rnorm, row_km = 2) +
    rowAnnotation(foo = 1:12) +
    rowAnnotation(bar = anno_barplot(1:12, width = unit(4, "cm")))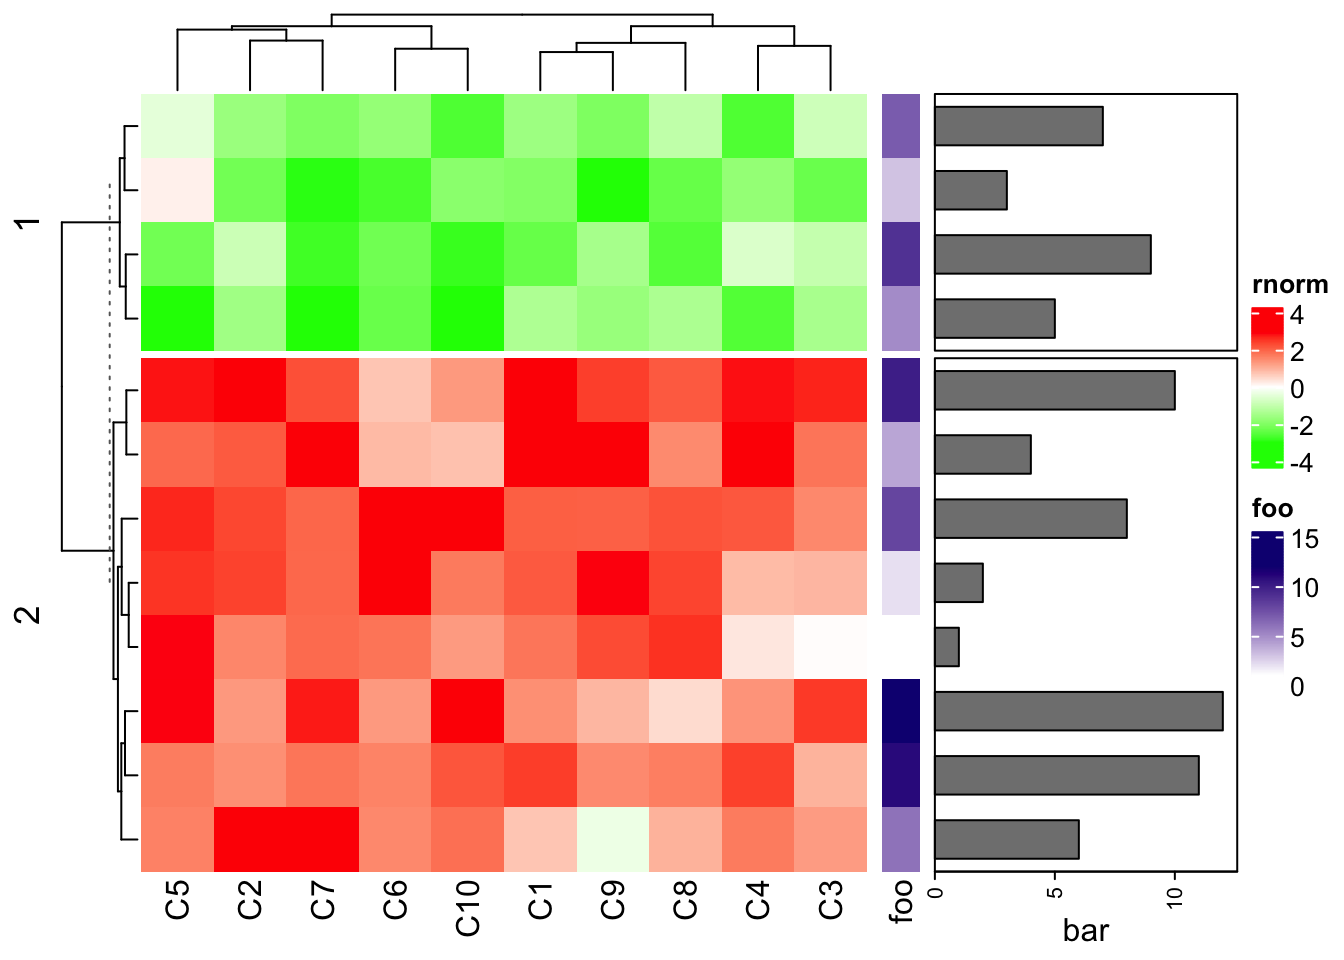
You may wonder how to recover the row names of mat1. There are two ways.
- you can set the row annotation as the “right annotation” of the heatmap and put the heatmap as the last one.
Heatmap(mat1, name = "rnorm", col = col_rnorm, row_km = 2, right_annotation = ha1)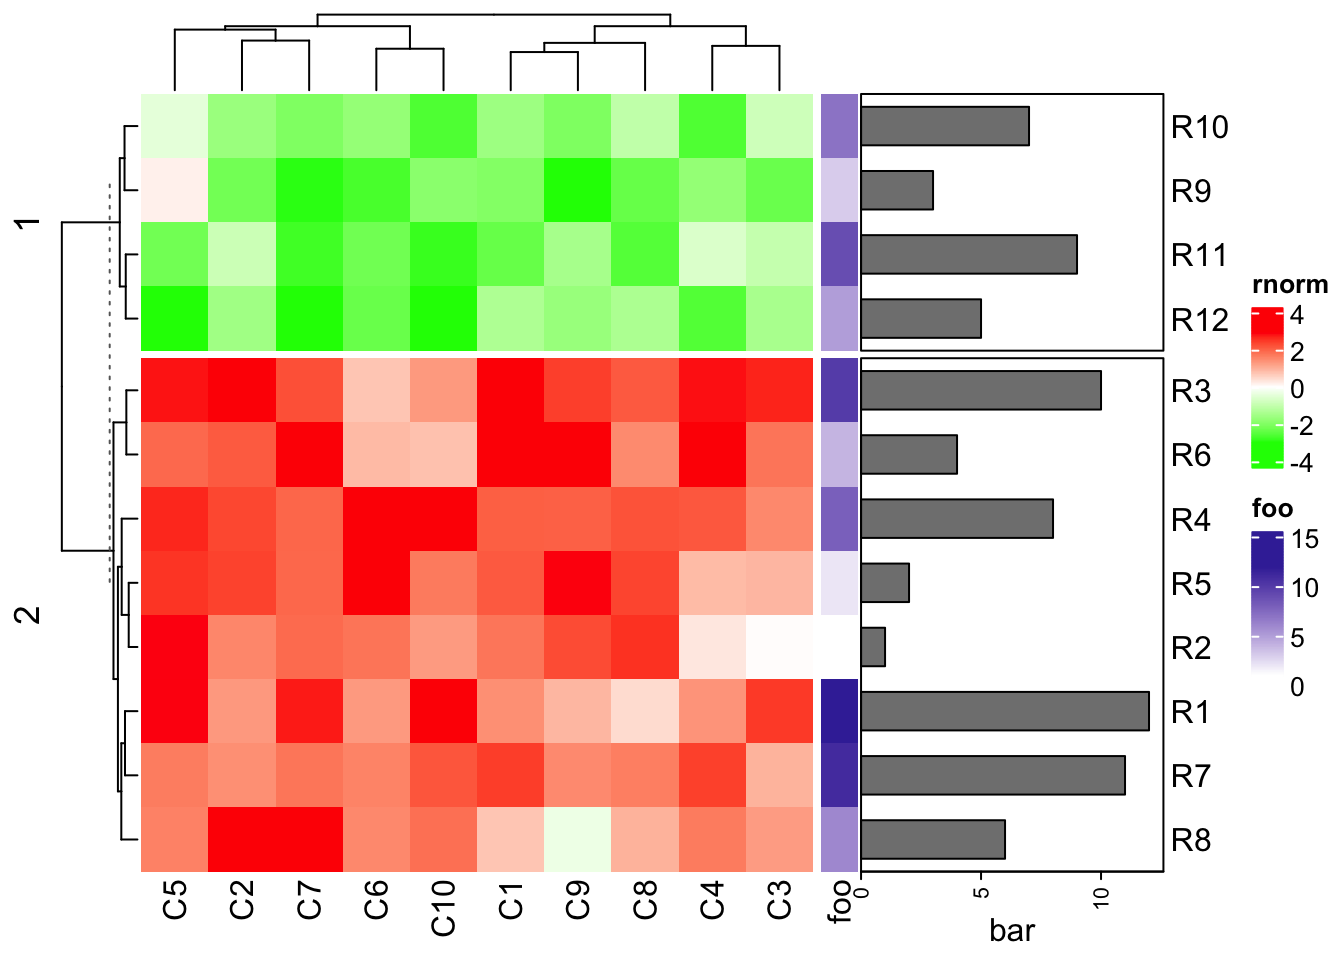
# or using the previous variable
# attach_annotation(ht1, ha1, side = "right")- add the row names by adding a text annotation:
ht1 + ha1 + rowAnnotation(rn = anno_text(rownames(mat1),
    location = unit(0, "npc"), just = "left"))
Basically heatmaps and row annotations can be concatenated arbitarily.
rowAnnotation(foo = 1:12) +
    Heatmap(mat1, name = "rnorm", col = col_rnorm, row_km = 2) +
    rowAnnotation(bar = anno_barplot(1:12, width = unit(4, "cm"))) +
    Heatmap(mat2, name = "runif", col = col_runif)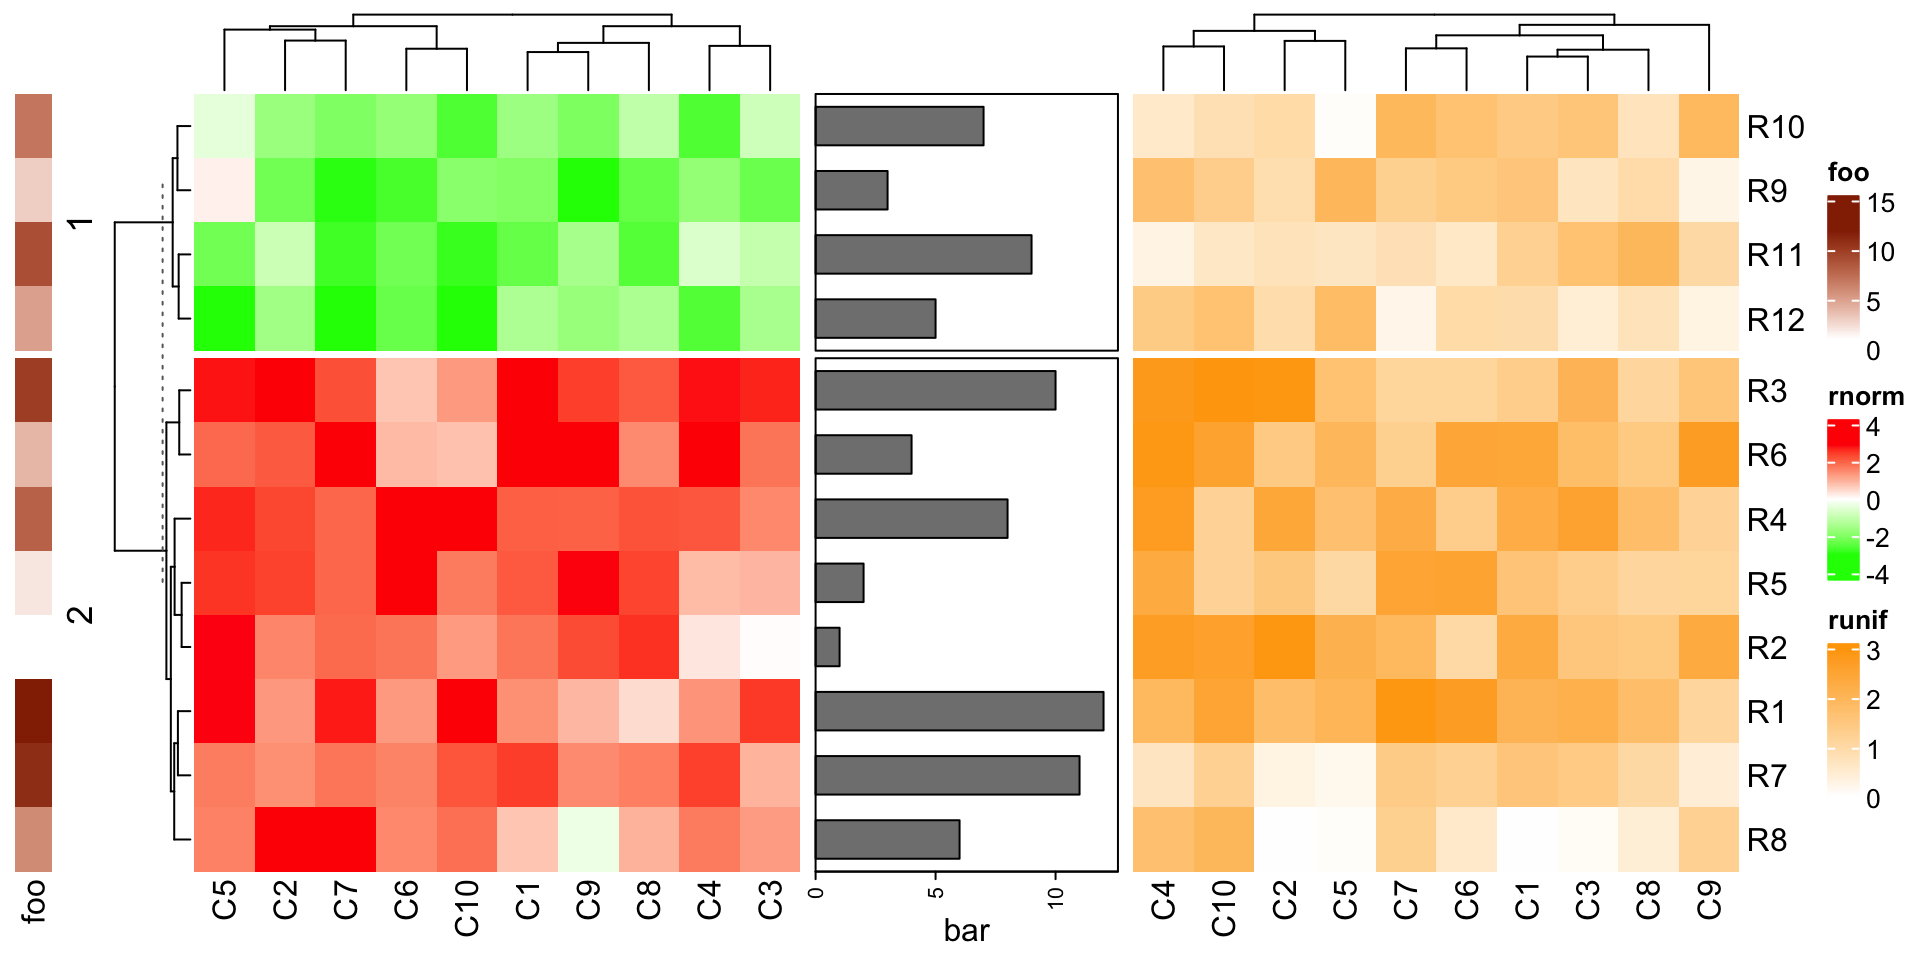
As mentioned in previous chapters, row annotations can also be heatmap components as left annotations or right annotations. The difference of row annotations as independent ones and as heatmap components is discussed in Section 4.9.
4.8 Concatenate only the annotations
The concatenation can be done without any heatmap.
rowAnnotation(foo = 1:12) +
    rowAnnotation(bar = anno_barplot(1:12, width = unit(4, "cm")))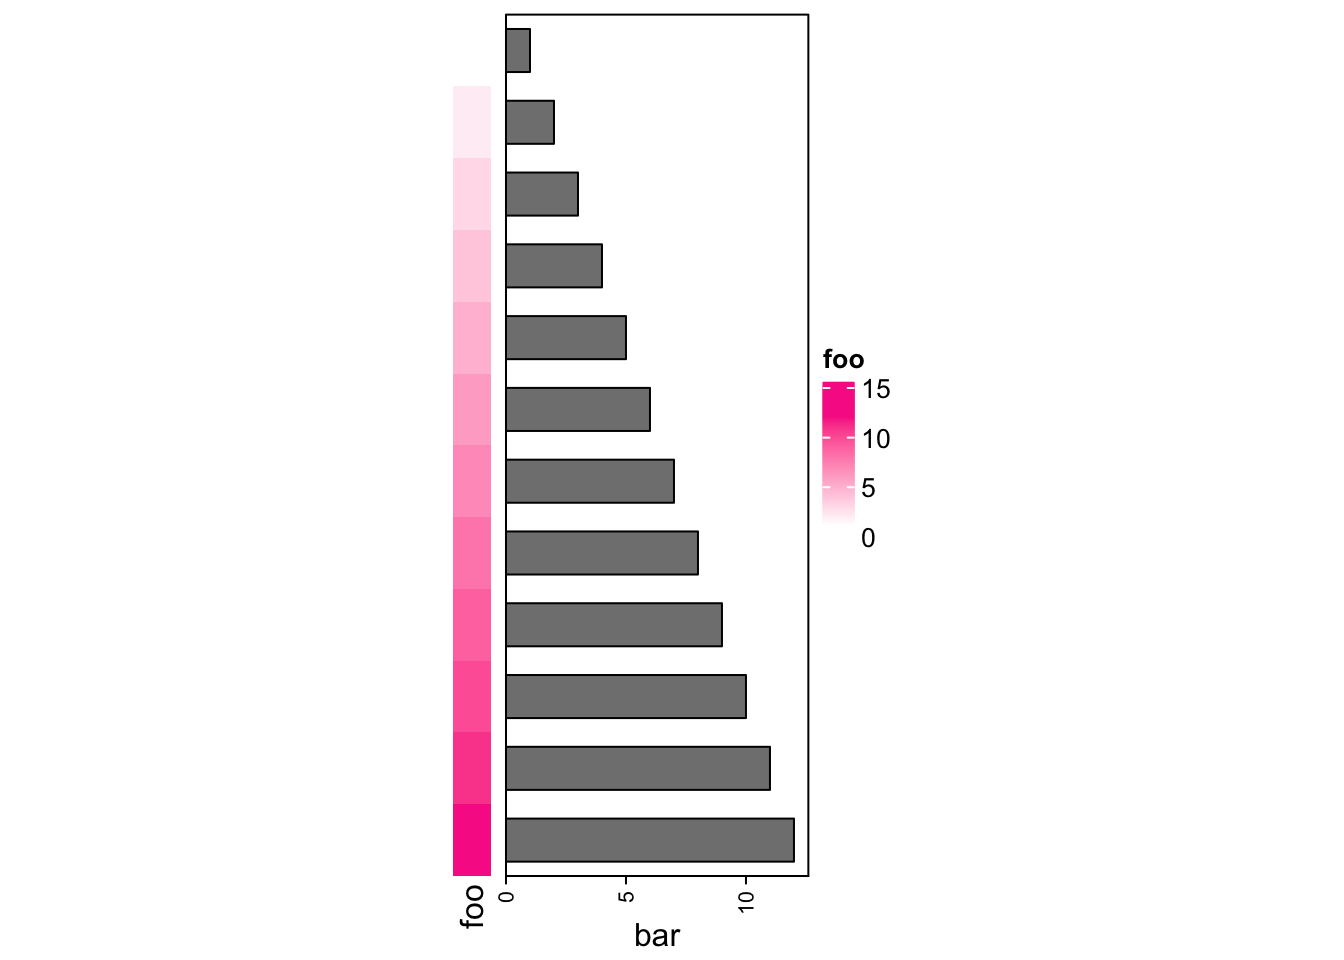
If there is only one HeatmapAnnotation object, you must concatenated with NULL.
rowAnnotation(bar = anno_barplot(1:12, width = unit(4, "cm"))) + NULL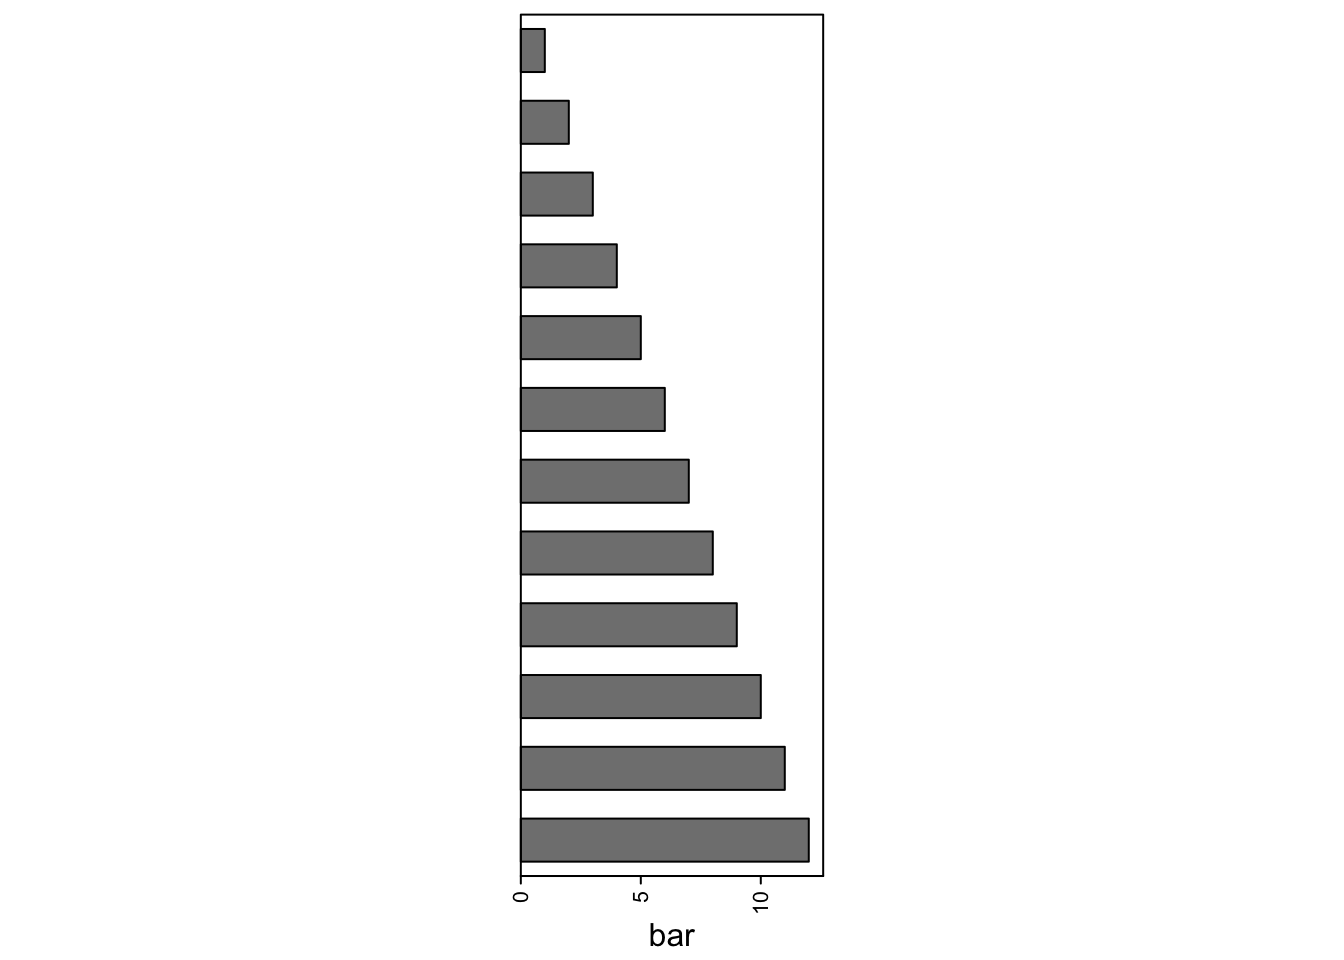
The annotation list is actually also a HeatmapList object.
anno_list = rowAnnotation(foo = 1:12) +
    rowAnnotation(bar = anno_barplot(1:12, width = unit(4, "cm")))
class(anno_list)
## [1] "HeatmapList"
## attr(,"package")
## [1] "ComplexHeatmap"Thus, you can use some functionalities of the draw() function for the
annotation list, such as row splitting.
In Section 11.2, we will show how to use a list of annotations to visualize multiple summary statistics.
4.9 Vertical concatenation
Heatmaps and annotations (now it is column annotation) can be concatenated
vertically by the %v% operator. All the relatated settings and adjustments
are very similar as the horizontal concatenation. Please check following
examples.
mat1t = t(mat1)
mat2t = t(mat2)
ht1 = Heatmap(mat1t, name = "rnorm", col = col_rnorm, row_title = "rnorm")
ht2 = Heatmap(mat2t, name = "runif", col = col_runif, row_title = "runif")
ht3 = Heatmap(rbind(letters = le), name = "letters", col = col_letters)
ht_list = ht1 %v% ht2 %v% ht3
draw(ht_list)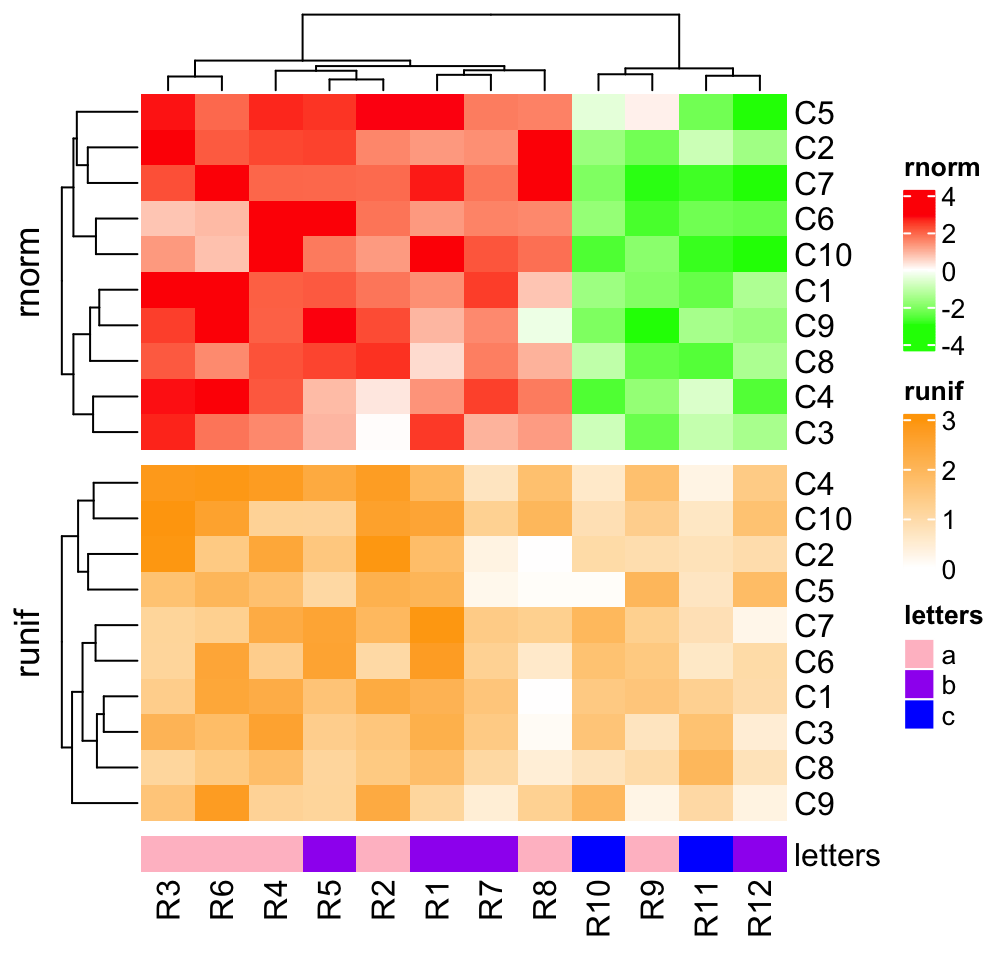
draw(ht_list, column_km = 2)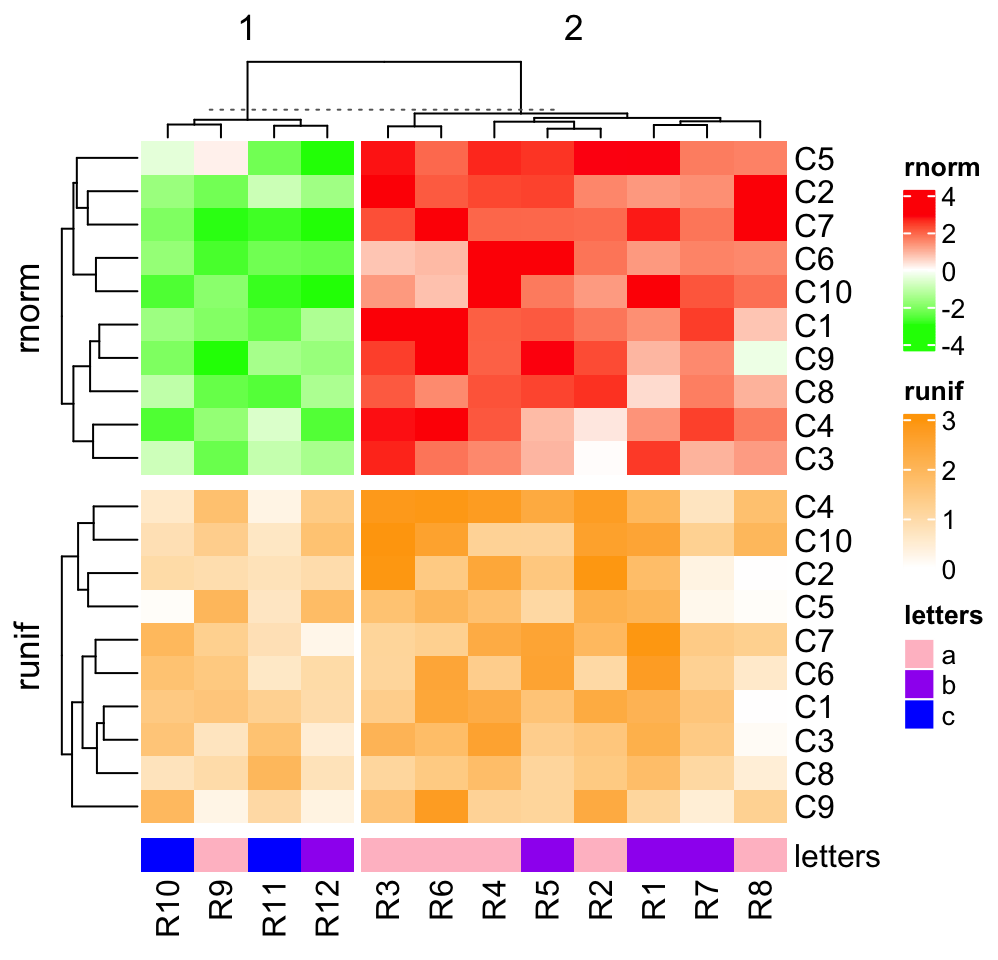
ha = HeatmapAnnotation(foo = anno_barplot(1:12, height = unit(2, "cm")))
ht_list = ht1 %v% ha %v% ht2 %v% ht3
draw(ht_list, column_km = 2)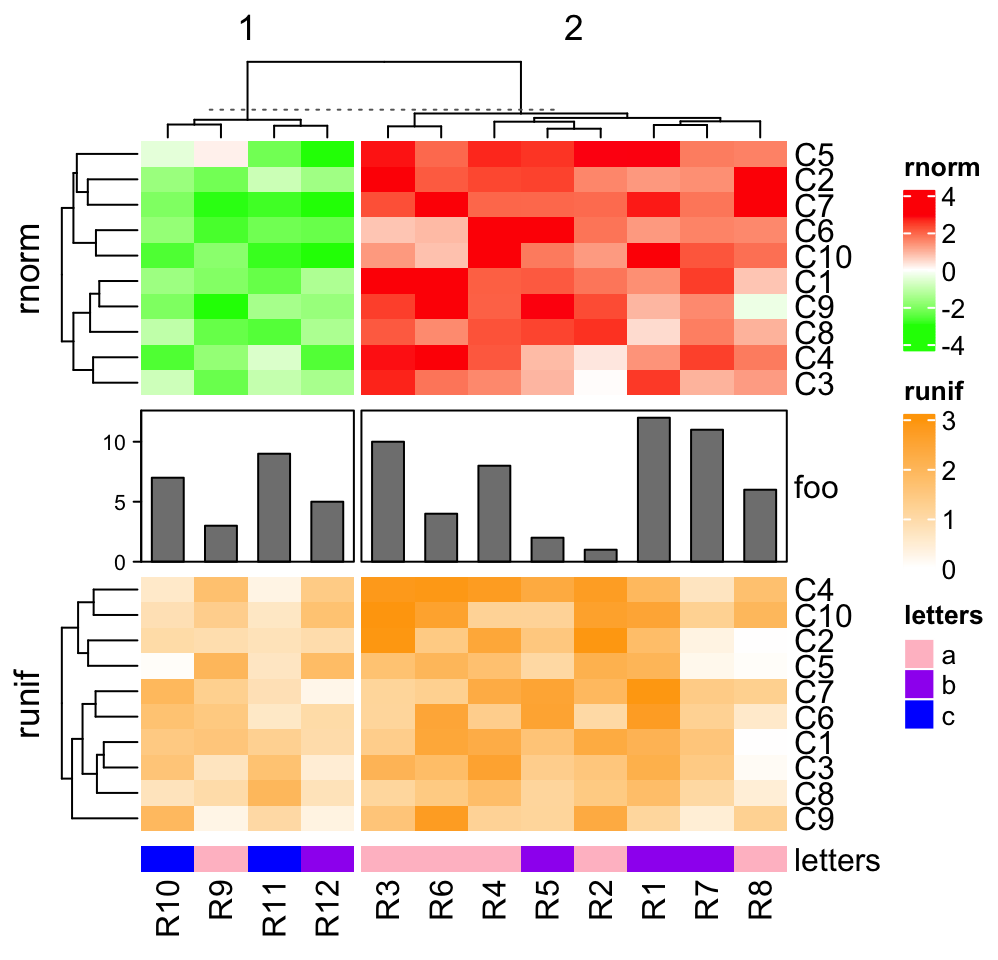
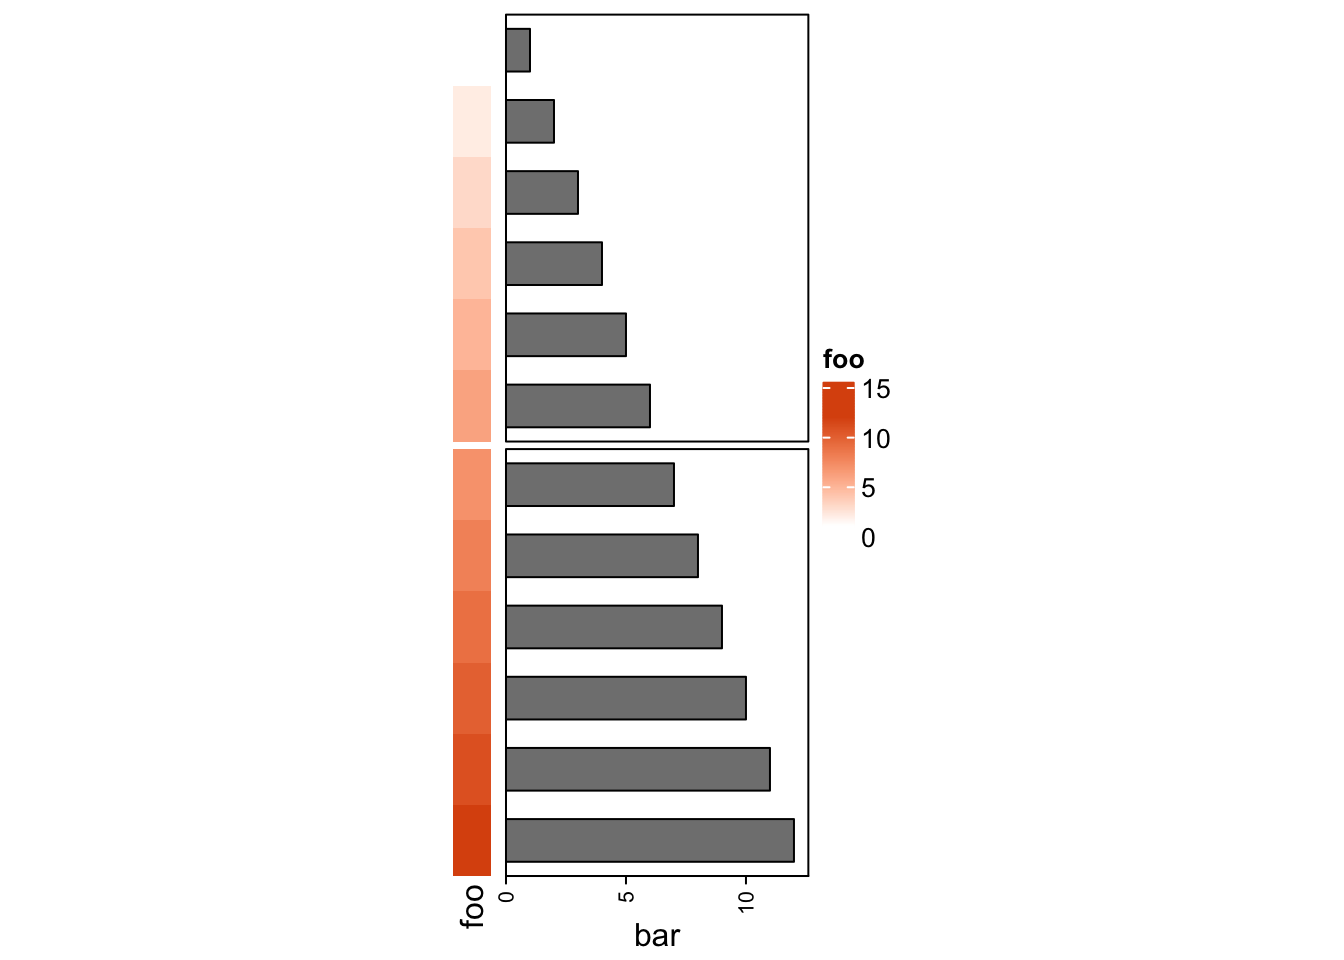
ht1 = Heatmap(mat1t, name = "rnorm", col = col_rnorm, row_km = 2)
ht2 = Heatmap(mat2t, name = "runif", col = col_runif, row_km = 2)
ht3 = Heatmap(rbind(letters = le), name = "letters", col = col_letters)
ha = HeatmapAnnotation(foo = anno_barplot(1:12, height = unit(2, "cm")))
ht_list = ht1 %v% ha %v% ht2 %v% ht3
draw(ht_list, column_km = 2)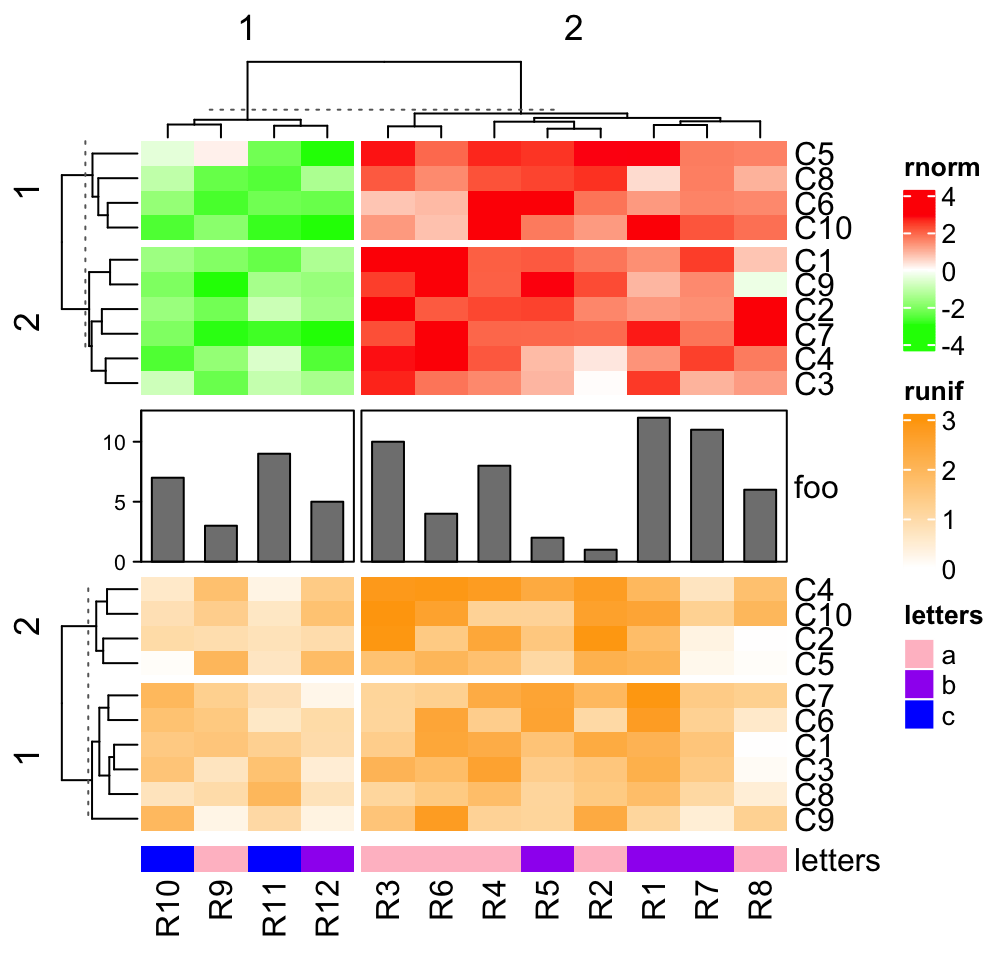
For the vertical heatmap list, now row annotations should be the heatmap
components (by right_annotation and left_annotation) and they are adjusted
just like column annotations for the horizontal heatmap list.
ht1 = Heatmap(mat1t, name = "rnorm", col = col_rnorm, row_km = 2,
    left_annotation = rowAnnotation(foo1 = 1:10, bar1 = anno_barplot(1:10)))
ha = HeatmapAnnotation(foo = anno_barplot(1:12, height = unit(2, "cm"),
    axis_param = list(side = "right")))
ht2 = Heatmap(mat2t, name = "runif", col = col_runif, row_km = 2,
    left_annotation = rowAnnotation(foo2 = 1:10))
ht3 = Heatmap(rbind(letters = le), name = "letters", col = col_letters)
ht_list = ht1 %v% ha %v% ht2 %v% ht3
draw(ht_list, column_km = 2)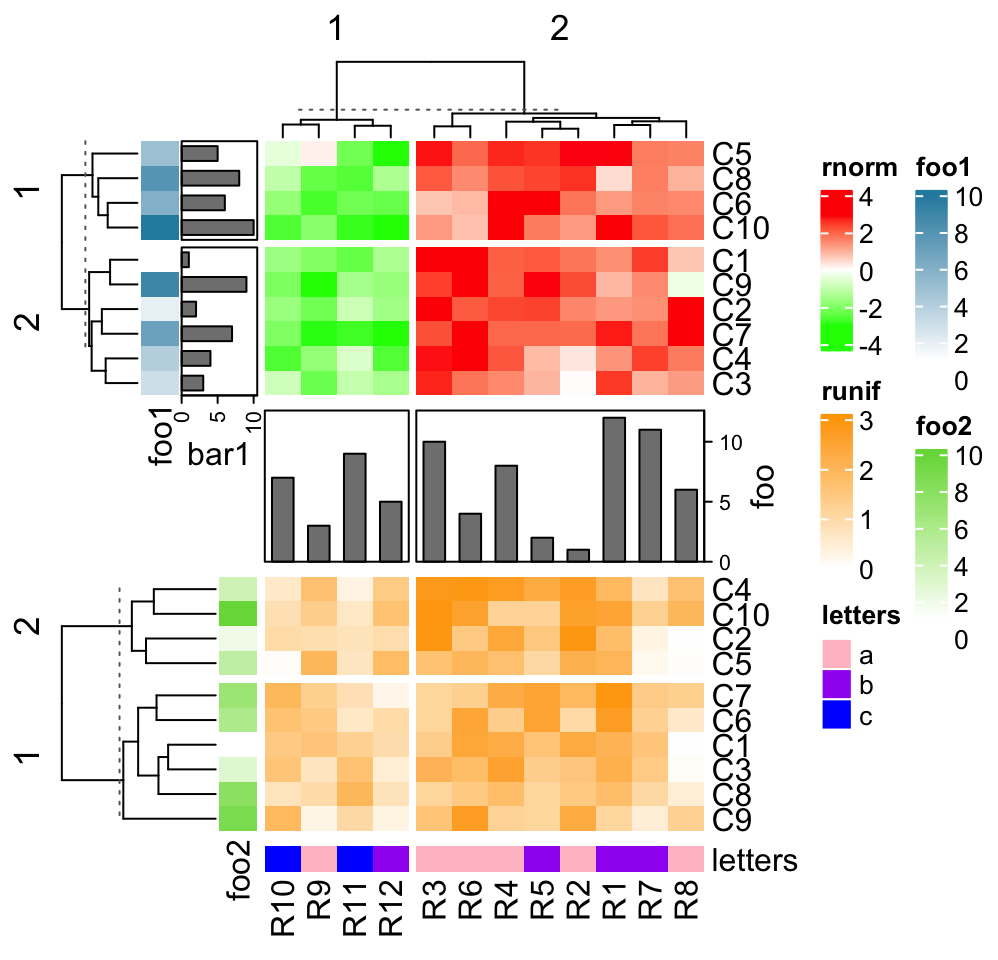
Since rowAnnotation() allows arbitary number of annotations, the way showed
above is the only way to expand the heatmap list horizontally and vertically
at the same time.
4.10 Subset the heatmap list
Similar as subsetting the Heatmap object (Section 2.13),
the heatmap list can also be subsetted by providing row index and column
index. For horizontal heatmap list, row index correspond to rows in all
heatmaps and annotations, while column index only corresponds to a subset of
heatmaps and annotations. For vertical heatmap list, it’s the other way
around.
In following we use horizontal heatmap list as example.
ht1 = Heatmap(mat1, name = "rnorm", col = col_rnorm,
    left_annotation = rowAnnotation(foo1 = 1:12, bar1 = anno_points(1:12)))
ht2 = Heatmap(mat2, name = "runif", col = col_runif)
ha = rowAnnotation(foo2 = anno_barplot(1:12), bar2 = 12:1)
ht_list = ht1 + ht2 + ha
names(ht_list)
## [1] "rnorm" "runif" "foo2" "bar2"
ht_list[1:6, c("rnorm", "bar2")]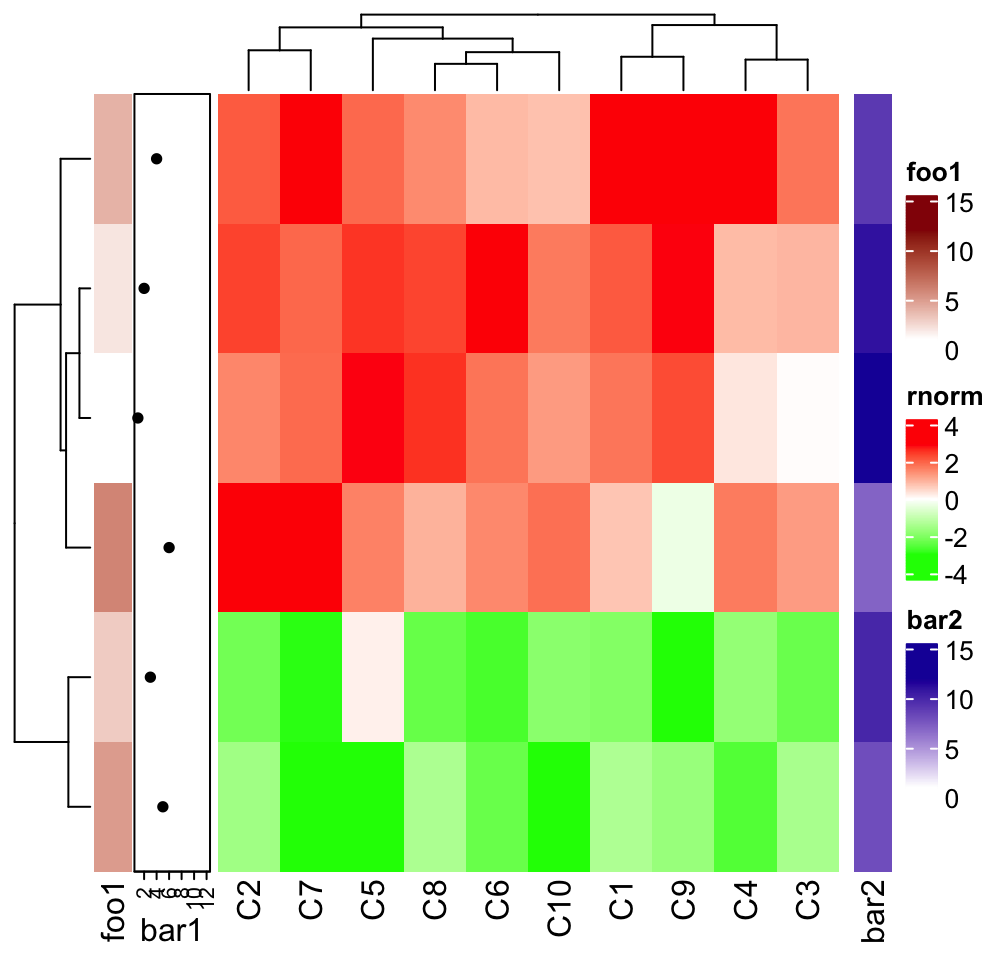
foo1 and bar are components of heatmap rnorm, so they can not be
selected in the subset function, while foo2 and bar2 are independent row
annotations and they can selected to take subset of them.
4.11 Plot the heatmap list
Similar as described in Section 2.11, directly entering the
HeatmapList object in interactive R session calls the show() method which
calls the draw() method internally. When there is no plot after you entering
the object, you should use draw() explicitly:
# code only for demonstration
draw(ht_list, ...)
4.12 Get orders and dendrograms
row_order(), column_order(), row_dend() and column_dend() can be used
to retrieve corresponding information from the heatmap list. The usage is
straightforward by following examples. But remember you need to apply these
functions on the object returned by draw().
ht1 = Heatmap(mat1, name = "rnorm", col = col_rnorm)
ht2 = Heatmap(mat2, name = "runif", col = col_runif)
ht_list = ht1 + ht2
ht_list = draw(ht_list)
row_order(ht_list)
## [1] 10 4 8 2 1 12 11 6 7 3 9 5
column_order(ht_list)## $rnorm
## [1] 5 2 7 6 10 1 9 8 4 3
##
## $runif
## [1] 4 10 2 5 7 6 1 3 8 9If rows or columns are split, the returned values will also be a list.
ht1 = Heatmap(mat1, name = "rnorm", col = col_rnorm)
ht2 = Heatmap(mat2, name = "runif", col = col_runif, column_km = 2)
ht_list = ht1 + ht2
ht_list = draw(ht_list, row_km = 2)
row_order(ht_list)
## $`1`
## [1] 7 3 9 5
##
## $`2`
## [1] 10 4 8 2 1 12 11 6
column_order(ht_list)## $rnorm
## $rnorm[[1]]
## [1] 5 2 7 6 10 1 9 8 4 3
##
##
## $runif
## $runif$`2`
## [1] 4 10 2 5
##
## $runif$`1`
## [1] 7 6 1 3 8 9You can specify a certain heatmap for the column order.
column_order(ht_list, name = "runif")## $`2`
## [1] 4 10 2 5
##
## $`1`
## [1] 7 6 1 3 8 9The logic is the same for extracting dendrograms and also the same for vertical heatmap list, so we don’t show more examples here.
4.13 Change parameters globally
ht_opt() is an option function which controls some parameters globally. You
can set some parameters for all heatmaps/annotations simultaneously by this
global function. Please note you should put it before your heatmap code and
reset all option values after drawing the heatmaps to get rid of affecting
next heatmap.
ht_opt## Option Value
## ----------------------------:--------------------
## heatmap_row_names_gp NULL
## heatmap_column_names_gp NULL
## heatmap_row_title_gp NULL
## heatmap_column_title_gp NULL
## legend_title_gp NULL
## legend_title_position NULL
## legend_labels_gp NULL
## legend_grid_height NULL
## legend_grid_width NULL
## legend_border NULL
## legend_gap 4mm, 4mm
## heatmap_border NULL
## annotation_border NULL
## fast_hclust FALSE
## show_parent_dend_line TRUE
## verbose FALSE
## message TRUE
## show_vp FALSE
## simple_anno_size 5mm
## DENDROGRAM_PADDING 0.5mm
## DIMNAME_PADDING 1mm
## TITLE_PADDING NULL
## COLUMN_ANNO_PADDING 1mm
## ROW_ANNO_PADDING 1mm
## HEATMAP_LEGEND_PADDING 2mm
## ANNOTATION_LEGEND_PADDING 2mm
## save_last FALSE
## validate_names TRUE
## raster_temp_image_max_width 30000
## raster_temp_image_max_height 30000
## COLOR blue, #EEEEEE, redThere are following parameters to control all heatmaps:
-
heatmap_row_names_gp: setrow_names_gpin allHeatmap(). -
heatmap_column_names_gp: setcolumn_names_gpin allHeatmap(). -
heatmap_row_title_gp: setrow_title_gpin allHeatmap(). -
heatmap_column_title_gp: setcolumn_title_gpin allHeatmap(). -
heatmap_border: setborderin allHeatmap().
Following parameters control the legends:
-
legend_title_gp: settitle_gpin all heatmap legends and annotation legends. -
legend_title_position: settitle_positionin all heatmap legends and annotation legends. -
legend_labels_gp: setlabels_gpin all heatmap legends and annotation legends. -
legend_grid_width: setgrid_widthin all heatmap legends and annotation legends. -
legend_grid_height: setgrid_heightin all heatmap legends and annotation legends. -
legend_border: setborderin all heatmap legends and annotation legends.
Following parameters control heatmap annotations:
-
annotation_border: setborderin allHeatmapAnnotation(). -
anno_simple_size: set size for the simple annotation.
Following parameters control the space between heatmap components:
-
DENDROGRAM_PADDING: space bewteen dendrograms and heatmap body. -
DIMNAME_PADDING: space between row/column names and heatmap body. -
TITLE_PADDING: space between row/column titles and heatmap body. -
COLUMN_ANNO_PADDING: space between column annotations and heatmap body. -
ROW_ANNO_PADDING: space between row annotations and heatmap body.
Other parameters:
-
fast_hclust: whether usefastcluster::hclust()to speed up clustering? -
show_parent_dend_line: when heatmap is split, whether to add a dashed line to mark parent dendrogram and children dendrograms?
You can get or set option values by the traditional way (like
base::options()) or by $ operator:
ht_opt("heatmap_row_names_gp")
ht_opt$heatmap_row_names_gp

# to set option values
ht_opt("heatmap_row_names_gp" = gpar(fontsize = 8))
ht_opt$heatmap_row_names_gp = gpar(fontsize = 8)
Reset to the default values by:
ht_opt(RESET = TRUE)Following example shows to control some graphic parameters globally.
ht_opt(heatmap_column_names_gp = gpar(fontface = "italic"),
    heatmap_column_title_gp = gpar(fontsize = 10),
    legend_border = "black",
    heatmap_border = TRUE,
    annotation_border = TRUE
)
ht1 = Heatmap(mat1, name = "ht1", column_title = "Heatmap 1",
    top_annotation = HeatmapAnnotation(foo = 1:10))
ht2 = Heatmap(mat2, name = "ht2", column_title = "Heatmap 2",
    top_annotation = HeatmapAnnotation(bar = 1:10))
ht1 + ht2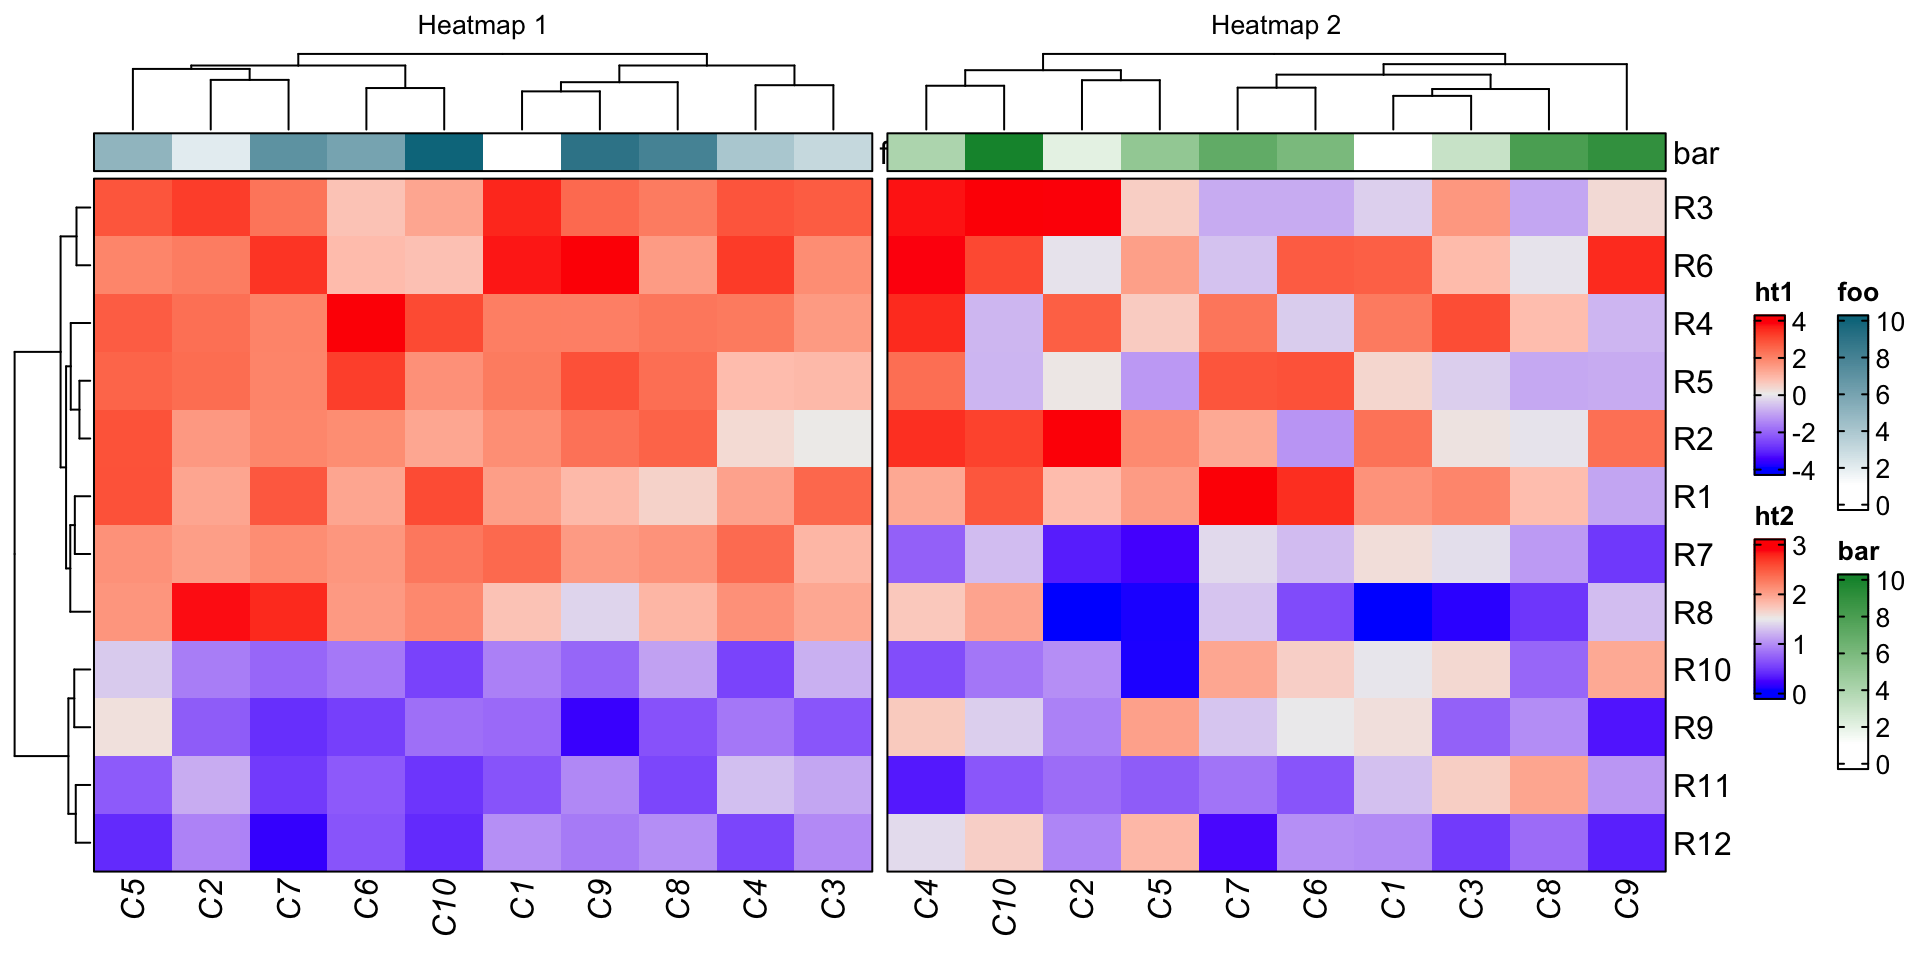
ht_opt(RESET = TRUE)These global parameters can also be set in the draw() function to
temporarily change the global parameters, and they are reset back after the
plot is made. Please check the help page of draw,HeatmapList-method.
4.14 Adjust blank space caused by annotations
Heatmap annotations may have annotation names and axes, for which the spaces are also taken into account when arranging heatmap components in the final layout. Sometimes, this adjustment is not smart that you may see blank areas in the plot that are not necessary.
One scenario is for a matrix with no row names, the space to the right of the heatmap is determined by the size of annotation name, which results in blank space between the heatmap and the legend. Also the heatmap list level row title is plotted to the left of the annotation axis, which gives blank area if there is no row dendrogram.
adjust_annotation_extension controls whether to take account of the space of
annotation names and axes for the layout. Compare following two plots.
m = matrix(rnorm(100), 10)
ht = Heatmap(m, name = "mat",
    top_annotation = HeatmapAnnotation(foo = anno_points(1:10)),
    show_row_dend = FALSE)
draw(ht, row_title = "fooooooooooo", adjust_annotation_extension = TRUE,  # default
    column_title = "adjust_annotation_extension = TRUE")
draw(ht, row_title = "fooooooooooo", adjust_annotation_extension = FALSE,
    column_title = "adjust_annotation_extension = FALSE")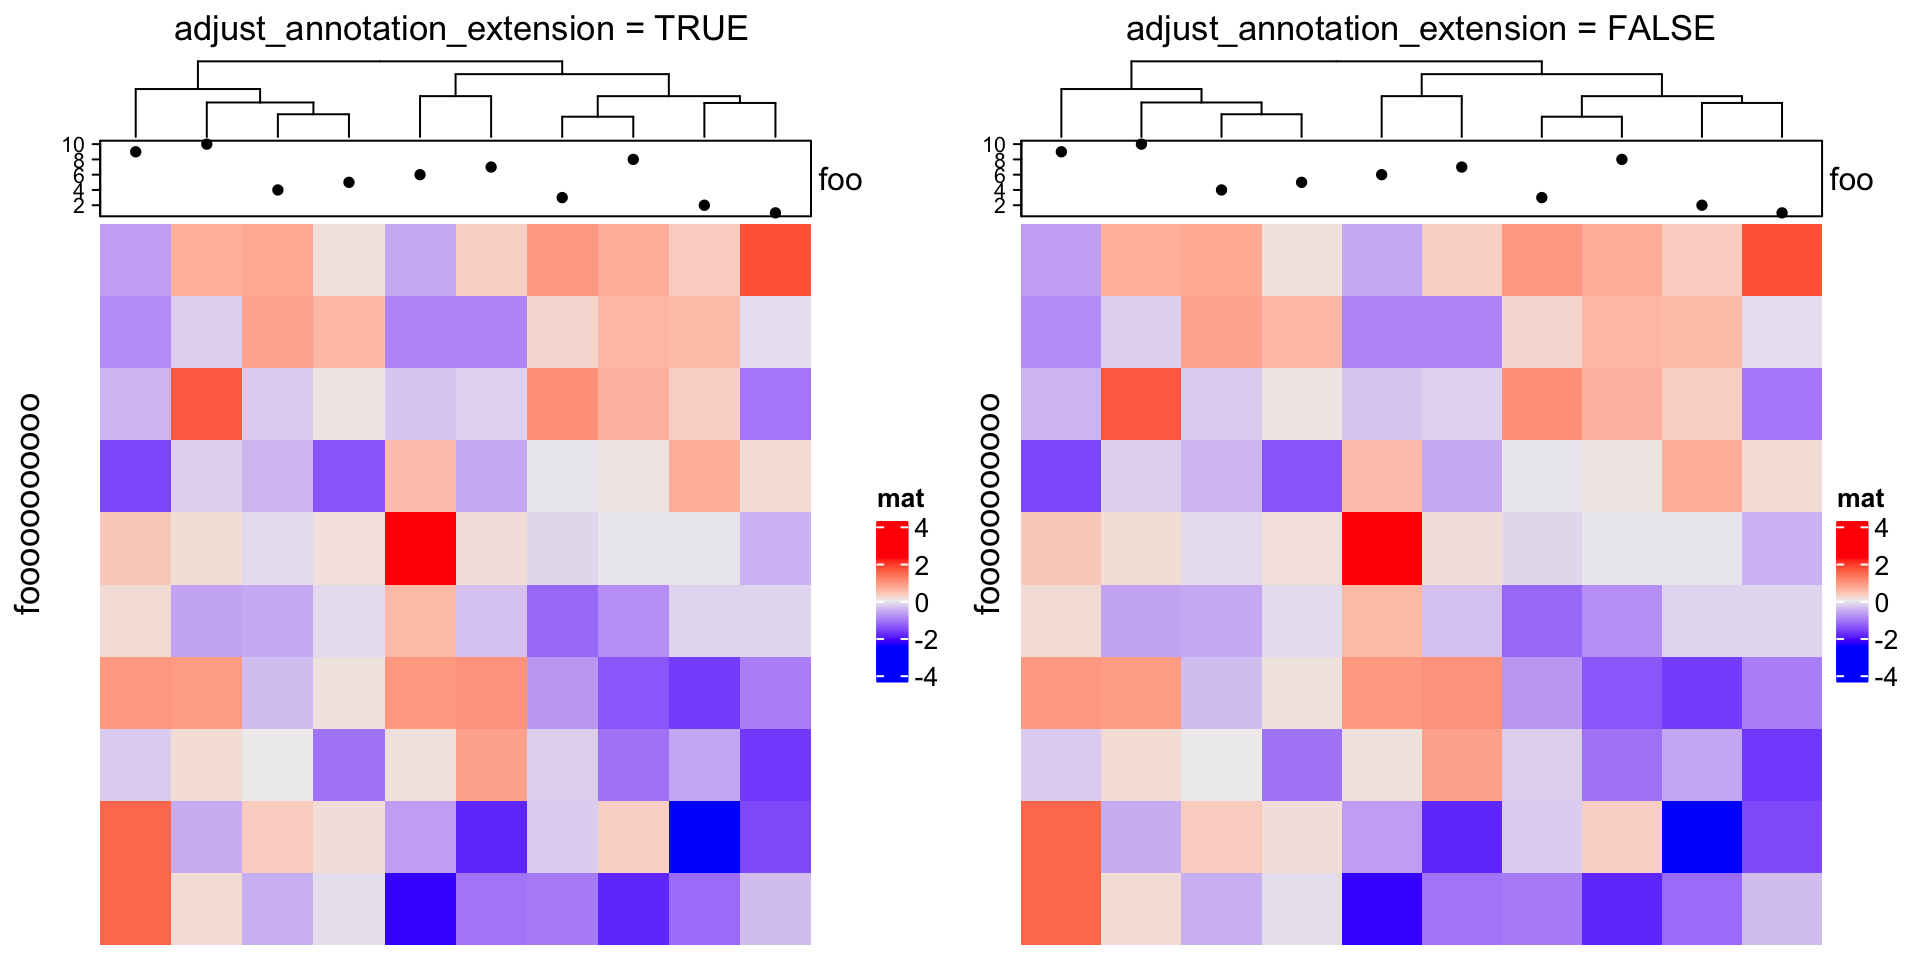
Another way to partially solve the space problem is to move the annotation name to the left and use heamtap-level row title.
Heatmap(m, name = "mat",
    top_annotation = HeatmapAnnotation(foo = anno_points(1:10),
        annotation_name_side = "left"),
    row_title = "fooooooooooo",
    show_row_dend = FALSE)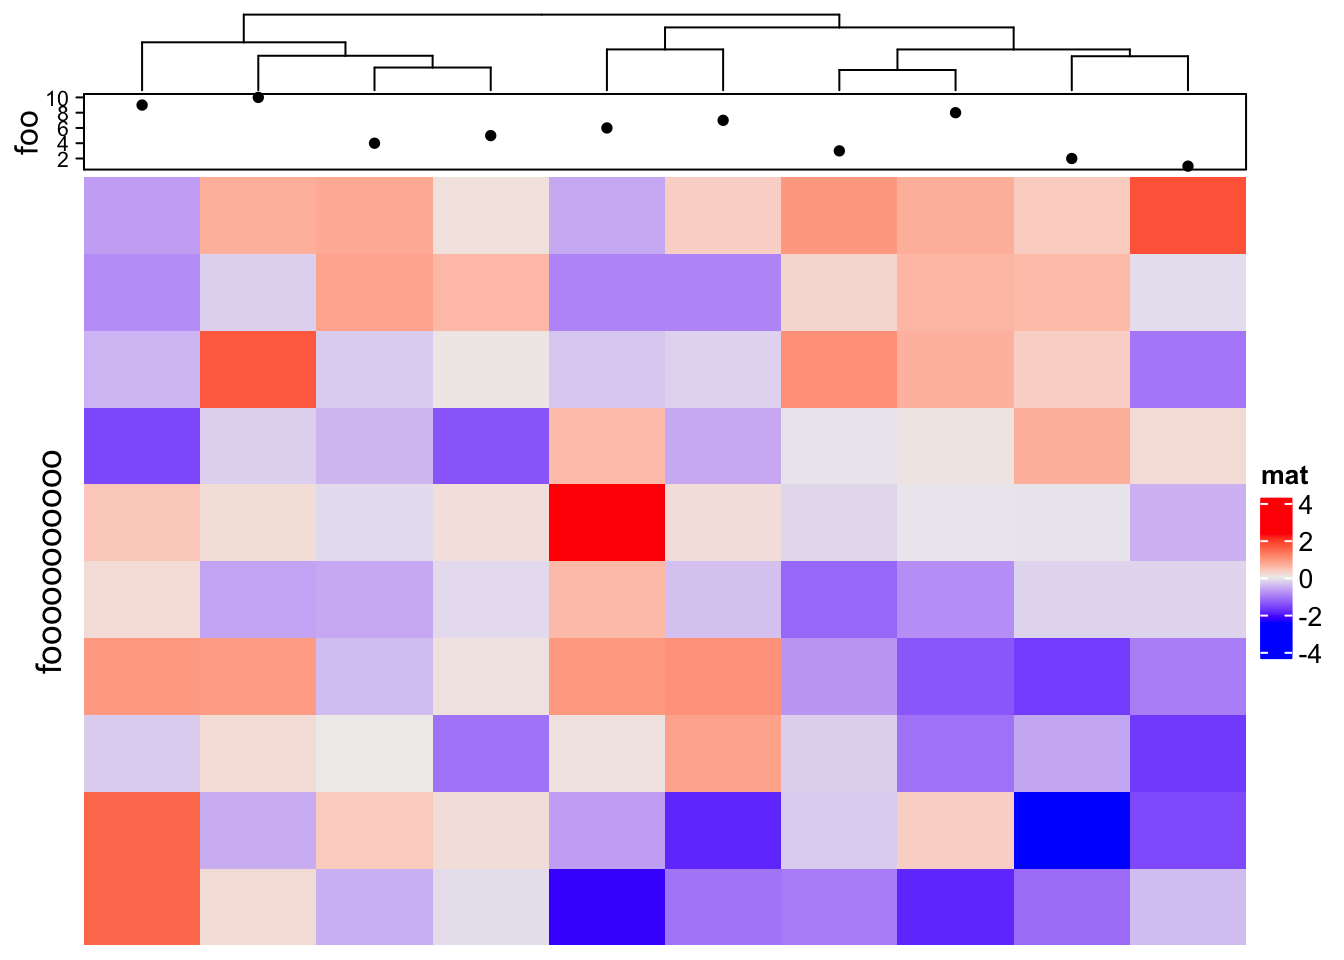
However, this adjustment for annotations sometimes is also necessary, e.g. when the heatmap is very short:
ht = Heatmap(m, name = "mat",
    top_annotation = HeatmapAnnotation(foo = anno_points(1:10)),
    show_row_dend = FALSE)
draw(ht, row_title = "fooooooooooo", adjust_annotation_extension = TRUE,
    column_title = "adjust_annotation_extension = TRUE")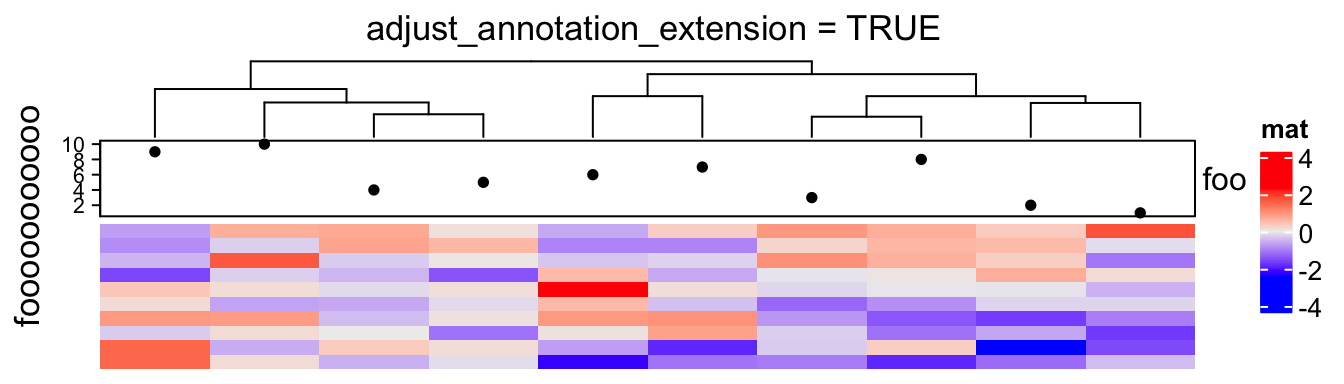
Therefore, we set TRUE as the default of adjust_annotation_extension and users can configure
it based on specific scenarios.
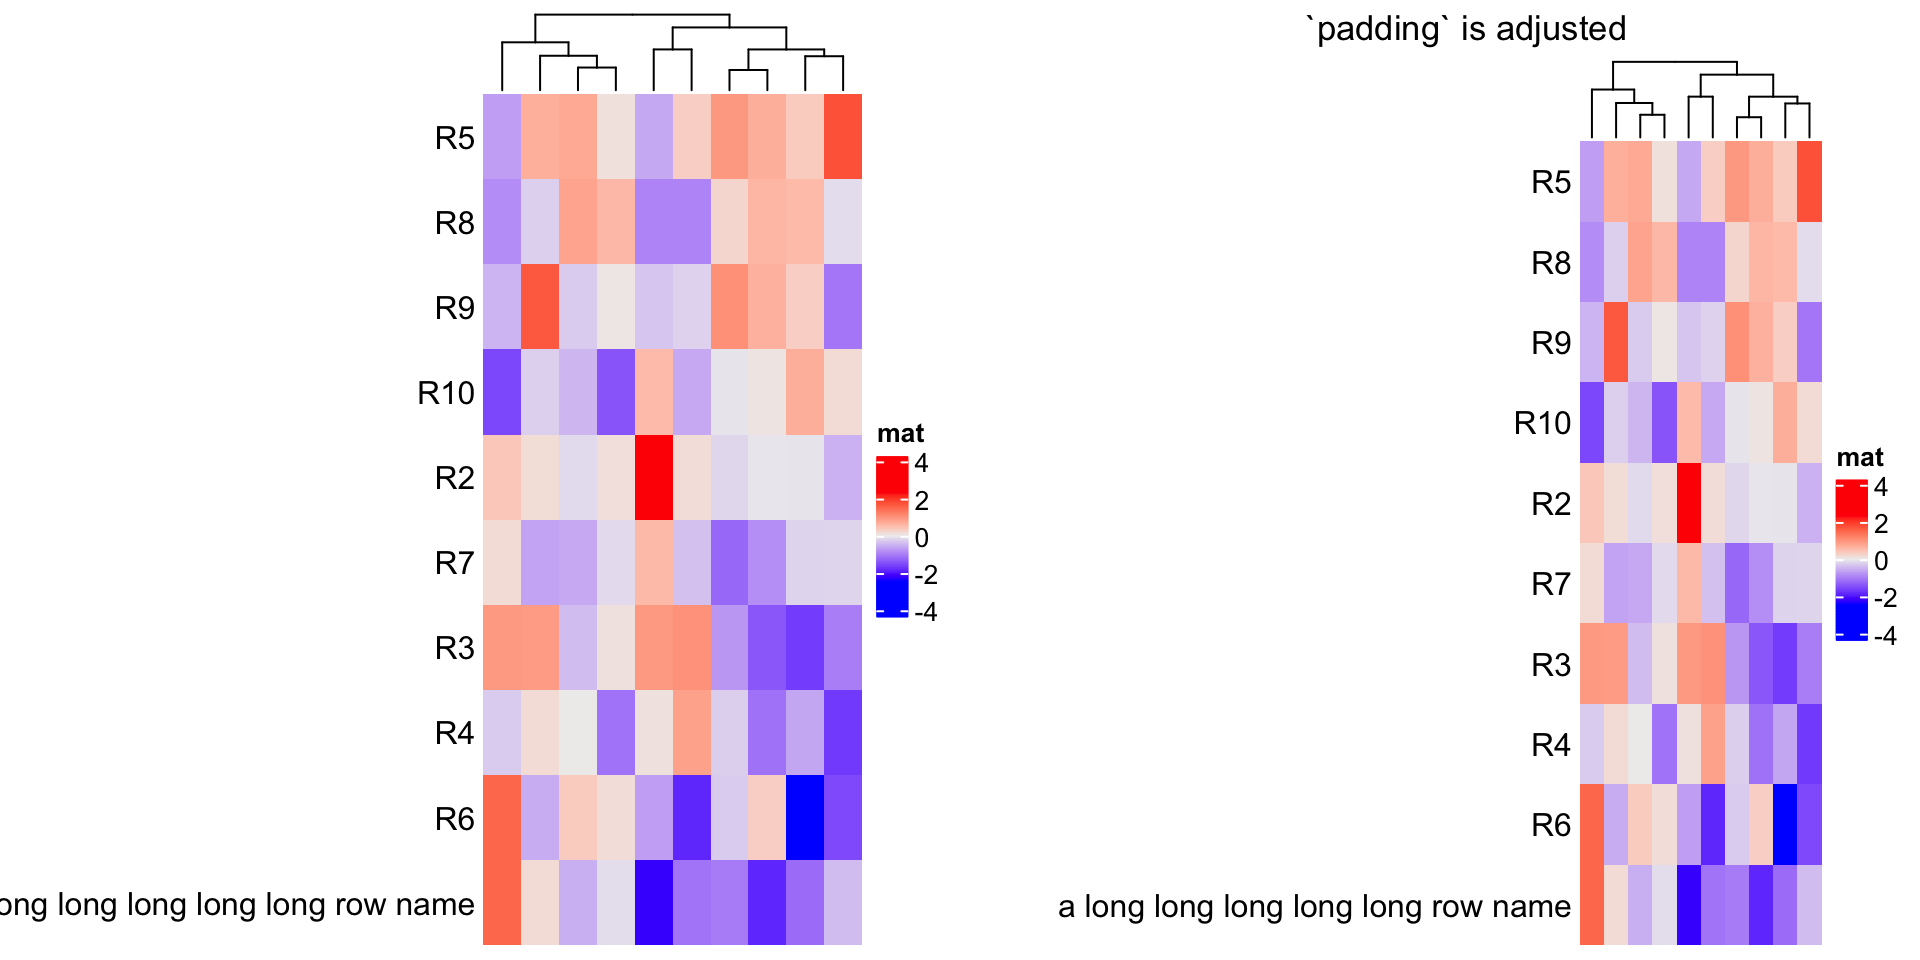
4.15 Manually increase space around the plot
The layout of the ComplexHeatmap is not perfect that it is still possible some of the text are
drawn out of the plotting region. In this case, you can manually set the padding argument in draw() function
to increase the blank areas around the final plot.
The value of padding should be a unit vector with length of four. The four values correspond to the space at
the bottom, left, top and right sides.
The following example is not a perfect example because the maximal width for row names can be controlled
by max_row_name_width argument, but we can still use it to demonstrate the use of padding.
m2 = m
rownames(m2) = paste0("R", 1:10)
rownames(m2)[1] = "a long long long long long row name"
ht = Heatmap(m2, name = "mat", row_names_side = "left", show_row_dend = FALSE)
draw(ht, padding = unit(c(2, 20, 2, 2), "mm")) ## see right heatmap in following