Topic 2-05: Use clusterProfiler for GSEA
Zuguang Gu z.gu@dkfz.de
2025-03-02
Source:vignettes/topic2_05_clusterProfiler_gsea.Rmd
topic2_05_clusterProfiler_gsea.RmdNote in clusterProfiler, p-values are calculated by gene permutations!
We use a dataset gene_diff_score which is a vector of a certain metric for differential expression of genes.
gene_diff_score = readRDS(system.file("extdata", "gene_diff_score.rds", package = "GSEAtraining"))
head(gene_diff_score)
## CDKN1A BAX MDM2 DDB2 STAT6 NTSR2
## 0.8425507 0.8232428 0.6306318 0.5945239 0.5791271 0.5712063We need to convert genes from symbols to EntreZ IDs.
library(org.Hs.eg.db)## Loading required package: AnnotationDbi## Loading required package: stats4## Loading required package: BiocGenerics##
## Attaching package: 'BiocGenerics'## The following objects are masked from 'package:stats':
##
## IQR, mad, sd, var, xtabs## The following objects are masked from 'package:base':
##
## anyDuplicated, aperm, append, as.data.frame, basename, cbind,
## colnames, dirname, do.call, duplicated, eval, evalq, Filter, Find,
## get, grep, grepl, intersect, is.unsorted, lapply, Map, mapply,
## match, mget, order, paste, pmax, pmax.int, pmin, pmin.int,
## Position, rank, rbind, Reduce, rownames, sapply, saveRDS, setdiff,
## table, tapply, union, unique, unsplit, which.max, which.min## Loading required package: Biobase## Welcome to Bioconductor
##
## Vignettes contain introductory material; view with
## 'browseVignettes()'. To cite Bioconductor, see
## 'citation("Biobase")', and for packages 'citation("pkgname")'.## Loading required package: IRanges## Loading required package: S4Vectors##
## Attaching package: 'S4Vectors'## The following object is masked from 'package:utils':
##
## findMatches## The following objects are masked from 'package:base':
##
## expand.grid, I, unname## ## 'select()' returned 1:many mapping between keys and columnshead(map)## CDKN1A BAX MDM2 DDB2 STAT6 NTSR2
## "1026" "581" "4193" "1643" "6778" "23620"# names(gene_diff_score) = map[ names(gene_diff_score) ]For this dataset, the mapping is 1:1. But you need to be careful when the mapping is not 1:1.
Here we use the convert_to_entrez_id() function from the GSEAtraining package, which automatically takes care of multiple mappings:
library(GSEAtraining)
gene_diff_score = convert_to_entrez_id(gene_diff_score)
## gene id might be SYMBOL (p = 1.000 )## 'select()' returned 1:many mapping between keys and columnshead(gene_diff_score)## 10 100 1000 10000 10001 10002
## 0.02683074 0.12681435 -0.13737449 0.13335944 -0.18805099 0.12855168Load the clusterProfiler package.
Next we perform GSEA on different gene set sources.
Before we start, gene_diff_score must be pre-sorted.
gene_diff_score = sort(gene_diff_score, decreasing = TRUE)GO enrichment
library(org.Hs.eg.db)
tb = gseGO(geneList = gene_diff_score, ont = "BP", OrgDb = org.Hs.eg.db)
head(tb)
## ID Description
## GO:1902850 GO:1902850 microtubule cytoskeleton organization involved in mitosis
## GO:0002250 GO:0002250 adaptive immune response
## GO:0030001 GO:0030001 metal ion transport
## GO:0040001 GO:0040001 establishment of mitotic spindle localization
## GO:0044088 GO:0044088 regulation of vacuole organization
## GO:0036503 GO:0036503 ERAD pathway
## setSize enrichmentScore NES pvalue p.adjust qvalue
## GO:1902850 71 -0.4575756 -2.129318 5.321037e-06 0.01162763 0.01044342
## GO:0002250 287 0.3459634 1.709586 6.993361e-06 0.01162763 0.01044342
## GO:0030001 480 0.3110690 1.590396 6.071969e-06 0.01162763 0.01044342
## GO:0040001 22 -0.6336977 -2.201947 5.709707e-05 0.01360461 0.01221905
## GO:0044088 29 -0.5791377 -2.161498 5.628390e-05 0.01360461 0.01221905
## GO:0036503 38 -0.5403979 -2.140556 3.891818e-05 0.01360461 0.01221905
## rank leading_edge
## GO:1902850 1730 tags=51%, list=26%, signal=38%
## GO:0002250 1536 tags=34%, list=23%, signal=28%
## GO:0030001 2101 tags=40%, list=31%, signal=30%
## GO:0040001 760 tags=45%, list=11%, signal=40%
## GO:0044088 1119 tags=48%, list=17%, signal=40%
## GO:0036503 1955 tags=58%, list=29%, signal=41%
## core_enrichment
## GO:1902850 991/5347/2316/7415/3303/4926/3925/23636/4134/1058/22974/2801/7283/9493/3833/8480/387/22919/332/55968/4085/9525/10252/8841/23291/8766/3837/891/10253/3611/7272/9183/10735/4751/9371/29899
## GO:0002250 6778/3140/6775/3439/11025/9466/5027/3565/3718/6556/7124/923/920/4063/27040/9021/10666/3109/729230/3441/3263/729/383/2213/713/3662/3598/10563/5321/1520/3448/2529/1439/3456/3111/2207/2185/6375/3560/2212/5294/3077/735/8764/7294/639/10865/6097/10411/5551/3570/5133/3566/113/3553/11118/7128/3592/1514/3115/11069/3119/3764/2215/7535/3458/11119/5580/3558/3113/3903/910/3146/4292/2267/3554/3329/974/10747/8767/814/7454/1380/23476/3717/6363/731/733/3442/326/3108/3702/924/708/1512/916/3122/10538
## GO:0030001 581/8912/2906/8514/150/7225/596/5371/3786/5027/3060/6524/6553/6568/6556/1017/23479/815/9058/920/845/6366/816/859/783/3756/1272/6539/10786/6540/8913/3263/9962/5187/81614/1812/3358/25800/6530/2783/486/5144/55117/6334/7369/1909/1814/5336/3758/4985/134/4891/90134/26133/5319/88/5581/6262/3357/9254/6687/9512/3208/967/6528/2185/6375/2833/3738/3780/2702/478/3777/623/3755/7178/6335/5330/5294/3077/9446/5664/5170/825/6263/9472/5332/23327/3749/6569/6340/475/2512/5743/1020/777/931/7222/9498/10266/1258/5587/10021/3764/1535/10268/10063/776/5024/3458/5026/10058/8884/5534/10246/6534/610/11194/4734/5774/491/3603/6363/6622/482/4842/1910/8671/309/64116/6531/6546/1230/9368/4504/3772/1213/2903/2288/4308/3709/3356/6387/1447/2905/3741/6236/9001/6548/6527/4283/8989/5348/10050/6574/468/774/57468/6557/7779/5142/1236/495/3782/9187/3768/2056/2815/5354/3785/2395/5788/6833/6520/1141/117/1499/1813/6616/488/22853/9312/496/1392/1636/6376/1908/3750/169522/25998/3751/207
## GO:0040001 22919/55968/4085/10252/8841/23291/3837/10253/9183/29899
## GO:0044088 5868/6048/950/4534/302/23256/51375/5532/51100/11152/29978/23232/1947/65018
## GO:0036503 7327/10134/22926/9709/6400/7415/4287/9354/811/6048/857/3309/51439/5706/7466/3300/267/4121/51465/29978/9097/10277KEGG enrichment
##                ID                             Description setSize
## hsa04080 hsa04080 Neuroactive ligand-receptor interaction     234
## hsa03010 hsa03010                                Ribosome      85
## hsa04060 hsa04060  Cytokine-cytokine receptor interaction     193
## hsa04940 hsa04940                Type I diabetes mellitus      36
## hsa04081 hsa04081                       Hormone signaling     180
## hsa05332 hsa05332               Graft-versus-host disease      29
##          enrichmentScore      NES       pvalue     p.adjust       qvalue rank
## hsa04080       0.4047809 1.939056 2.685507e-08 8.889027e-06 7.462881e-06 2404
## hsa03010       0.5117854 2.142851 3.165849e-07 5.239480e-05 4.398864e-05 2348
## hsa04060       0.3930792 1.845331 1.454019e-06 1.604267e-04 1.346880e-04 1812
## hsa04940       0.5966921 2.091070 7.787343e-06 6.444026e-04 5.410154e-04 1530
## hsa04081       0.3760290 1.753399 1.834435e-05 1.214396e-03 1.019560e-03 1681
## hsa05332       0.6066064 2.014217 9.454189e-05 5.215561e-03 4.378782e-03 1762
##                            leading_edge
## hsa04080 tags=52%, list=36%, signal=35%
## hsa03010 tags=60%, list=35%, signal=40%
## hsa04060 tags=45%, list=27%, signal=34%
## hsa04940 tags=56%, list=23%, signal=43%
## hsa04081 tags=39%, list=25%, signal=30%
## hsa05332 tags=62%, list=26%, signal=46%
##                                                                                                                                                                                                                                                                                                                                                                                                                                                                                                                                                                                                             core_enrichment
## hsa04080 23620/2906/150/2901/9248/2151/6870/7425/5027/3060/3362/4544/2911/6753/3351/3360/7432/1907/1444/9934/680/1812/3358/1145/4157/6344/5741/887/8973/146/1909/1814/5368/4985/134/186/2562/2642/551/4161/3357/3363/7434/623/4295/153/8620/2689/4829/885/2558/3001/4987/2554/2695/4158/3640/5024/2918/8484/1816/6013/2688/1511/5026/2560/152/1142/5697/7200/2569/1910/1269/3953/2798/6754/6915/7068/6755/5443/4852/719/2914/5367/2903/3356/2905/2691/5173/4887/3827/1141/117/2742/2899/2561/5739/6019/1813/1392/1908/727/2690/3972/2912/2897/2692/3375/796/554/4889/1144/6752/9002/5724/3952/4988/8001/5729/1136/2890/5025
## hsa03010                                                                                                                                                                                                                                                                                                                                                   6223/6171/6192/6232/6175/6137/6210/6143/6176/6169/6182/6128/9349/6122/6139/6168/6187/6224/6147/6160/6124/6209/9801/6218/6155/6150/6152/6194/6158/6228/6235/6233/6129/6234/6173/23521/6201/6156/6193/6132/65005/6222/6191/6157/6204/6142/6144/9045/6203/6183/4736
## hsa04060                                                                                                                                                                 355/3439/9518/9466/1436/3552/3623/3565/8744/6357/7124/1896/920/6366/1444/353500/1237/729230/3441/6372/6370/7293/2919/3598/3568/10563/3448/2920/1439/1440/10850/3456/6362/4050/6375/3560/2833/1271/6360/1441/8764/5008/943/2689/6354/3570/6356/3566/3553/4055/3592/7066/6364/6846/3458/1270/3595/93/3558/2688/91/3556/7046/3554/8600/3603/7850/6363/3574/11009/3600/3953/3442/8718/1230/6368/8793/9173/3590/6387/3624/3455/4283/3562/8795/2662/8794
## hsa04940                                                                                                                                                                                                                                                                                                                                                                                                                                                                                                                 355/3552/7124/3109/3111/3002/3630/5551/3553/5798/3592/3115/3119/5799/3458/3558/3113/3329/3108/3122
## hsa04081                                                                                                                                                                                                                                                         2100/150/2980/3060/6714/6753/7432/1444/112/107/2775/2099/8660/1812/4157/2783/3481/5741/887/146/1814/5368/4985/186/5568/2642/551/5592/4161/7434/3630/5330/4295/153/10411/2689/5332/2788/885/113/2984/2792/4093/4987/11069/10266/7066/10672/10268/115/2695/1733/4158/1816/2688/152/3717/7200/79602/4842/109/3953/2798/6754/7068/6755/5443/5367/108/8503/2691
## hsa05332                                                                                                                                                                                                                                                                                                                                                                                                                                                                                                                         355/3552/7124/3109/3111/3002/5551/3553/3115/115653/3119/3458/3558/3113/3108/3122/3812/3125
Reactome enrichment
## ReactomePA v1.50.0 Learn more at https://yulab-smu.top/contribution-knowledge-mining/
##
## Please cite:
##
## Guangchuang Yu, Qing-Yu He. ReactomePA: an R/Bioconductor package for
## reactome pathway analysis and visualization. Molecular BioSystems.
## 2016, 12(2):477-479
tb = gsePathway(geneList = gene_diff_score, organism = "human")## using 'fgsea' for GSEA analysis, please cite Korotkevich et al (2019).## preparing geneSet collections...## GSEA analysis...## leading edge analysis...## done...head(tb)## ID Description setSize
## R-HSA-1640170 R-HSA-1640170 Cell Cycle 347
## R-HSA-69278 R-HSA-69278 Cell Cycle, Mitotic 275
## R-HSA-373076 R-HSA-373076 Class A/1 (Rhodopsin-like receptors) 197
## R-HSA-500792 R-HSA-500792 GPCR ligand binding 267
## R-HSA-68886 R-HSA-68886 M Phase 171
## R-HSA-388396 R-HSA-388396 GPCR downstream signalling 402
## enrichmentScore NES pvalue p.adjust qvalue
## R-HSA-1640170 -0.3243844 -1.925059 6.002231e-10 8.109014e-07 6.602454e-07
## R-HSA-69278 -0.3426571 -1.945311 1.529960e-09 1.033488e-06 8.414779e-07
## R-HSA-373076 0.4374683 2.068011 4.205763e-09 1.893995e-06 1.542113e-06
## R-HSA-500792 0.3977675 1.943684 1.100185e-08 3.715874e-06 3.025508e-06
## R-HSA-68886 -0.3744910 -1.996964 1.061301e-07 2.867634e-05 2.334861e-05
## R-HSA-388396 0.3437343 1.735064 1.797336e-07 4.047002e-05 3.295116e-05
## rank leading_edge
## R-HSA-1640170 1750 tags=39%, list=26%, signal=30%
## R-HSA-69278 1565 tags=38%, list=23%, signal=30%
## R-HSA-373076 1666 tags=43%, list=25%, signal=33%
## R-HSA-500792 1681 tags=39%, list=25%, signal=31%
## R-HSA-68886 1565 tags=40%, list=23%, signal=31%
## R-HSA-388396 1681 tags=37%, list=25%, signal=30%
## core_enrichment
## R-HSA-1640170 1022/4171/5693/991/5347/6847/6119/472/5687/5520/10714/5433/6502/4926/8317/11130/7443/10213/7514/140609/7014/23636/9184/1875/1032/701/23511/7027/4438/1063/1457/7529/1058/22974/23198/5594/4000/9491/2801/4218/890/1736/8815/1616/5932/7283/699/9493/5436/5934/10733/5432/5690/994/5700/5431/5982/91754/5685/1460/7153/2237/5981/5711/8480/10844/3364/22919/5519/3161/2810/332/5529/5695/4085/1859/5706/9232/990/25836/5905/203068/5933/11339/23291/5683/54107/2010/23279/7341/6117/5721/5928/546/1031/3837/10121/7324/891/7531/10133/902/996/1719/5528/7156/1030/5686/5702/8556/5500/5720/7465/23649/995/23133/3065/5753/9183/6118/11065/10735/5537/1111/5689/5437/9663/4751/1029/2033/11004/5527/5526/5810/9631
## R-HSA-69278 4926/8317/11130/7443/10213/7514/140609/23636/9184/1875/1032/701/23511/7027/1063/1457/1058/22974/23198/5594/4000/9491/2801/4218/890/8815/7283/699/9493/5934/10733/5690/994/5700/5982/91754/5685/1460/7153/2237/5981/5711/8480/10844/22919/5519/3161/332/5529/5695/4085/1859/5706/9232/990/25836/5905/203068/5933/23291/5683/54107/2010/23279/7341/6117/5721/5928/1031/3837/10121/7324/891/7531/10133/902/996/1719/5528/1030/5686/5702/8556/5500/5720/7465/23649/995/23133/3065/5753/9183/6118/11065/10735/5689/9663/4751/1029/2033/11004/5527/5526/9631
## R-HSA-373076 23620/150/2151/6870/3060/3362/4544/6357/6753/3351/6366/3360/1907/1237/9934/680/729230/8477/6372/6370/2919/1812/3358/4157/887/146/1909/1814/10563/5368/4985/134/186/2920/551/4161/3357/10850/3363/9718/2841/6375/2833/623/10692/4935/6360/4295/153/8620/6354/6356/4829/885/4987/6364/6846/4158/3640/8484/1816/5995/8111/152/6363/5697/7200/2853/1910/1269/2798/1230/6754/6915/6368/6755/5443/4852/719/5367/6010/9283/3356/6387
## R-HSA-500792 23620/150/2151/6870/3060/3362/4544/2911/6357/6753/3351/6608/6366/3360/7432/1907/1237/9934/680/729230/8477/6372/6370/2919/1812/3358/4157/2783/6344/5741/887/146/1909/1814/10563/5368/50846/4985/134/186/2642/2920/551/4161/3357/6469/10850/3363/7482/9718/7434/2841/6375/2833/7476/623/10692/4935/6360/4295/153/8620/2788/6354/6356/4829/885/7475/2792/4987/10266/6364/10268/2695/6846/4158/3640/2918/8484/1816/5995/8111/152/6363/5697/7200/2853/1910/1269/2798/1230/6754/6915/6368/6755/5443/4852/719/2914/5367/6010/9283/3356/6387/2691
## R-HSA-68886 4926/11130/7443/10213/7514/140609/23636/9184/701/23511/1063/1457/1058/23198/5594/4000/9491/2801/8815/7283/699/9493/10733/5690/5700/91754/5685/1460/5711/8480/10844/22919/5519/332/5529/5695/4085/5706/9232/25836/5905/203068/5683/2010/23279/7341/5721/3837/10121/7324/891/7531/996/5528/5686/5702/5720/23133/9183/11065/10735/5689/9663/4751/11004/5527/5526/9631
## R-HSA-388396 23620/5136/150/7225/2151/6870/3060/3362/4544/2911/6357/6714/6753/3351/815/6366/3360/7432/1907/816/1237/9934/680/729230/5573/8477/8601/112/107/6372/6370/2919/1812/3358/4157/2783/6344/5144/5741/887/146/1909/5138/1814/10563/5368/5321/4985/134/186/5568/9639/2642/2920/10636/5581/1608/551/4161/3357/10850/3363/6002/5153/7434/2841/6375/2833/623/10692/2780/4935/5330/5294/63940/6360/4295/153/5170/8620/5332/2788/4829/885/113/1020/7222/2792/4987/10266/10672/2843/7410/6364/10268/115/2695/6846/4158/3640/2918/5580/8484/1816/5140/5995/7409/8111/5534/814/152/5141/6363/5697/7200/2853/1910/109/388/1269/9138/4168/2798/9826/1230/6754/1606/10276/6001/6915/6368/5996/6755/5443/4852/719/2914/8527/5367/2870/6010/9283/108/8503/3709/3356/6387/10235/2691DO enrichment
## DOSE v4.0.0 Learn more at https://yulab-smu.top/contribution-knowledge-mining/
##
## Please cite:
##
## Guangchuang Yu, Li-Gen Wang, Guang-Rong Yan, Qing-Yu He. DOSE: an
## R/Bioconductor package for Disease Ontology Semantic and Enrichment
## analysis. Bioinformatics. 2015, 31(4):608-609
tb = gseDO(geneList = gene_diff_score)## using 'fgsea' for GSEA analysis, please cite Korotkevich et al (2019).## preparing geneSet collections...## GSEA analysis...## leading edge analysis...## done...head(tb)## ID Description setSize enrichmentScore
## DOID:10952 DOID:10952 nephritis 174 0.3899824
## DOID:0050117 DOID:0050117 disease by infectious agent 372 0.3272434
## DOID:3213 DOID:3213 demyelinating disease 106 0.4326570
## DOID:2377 DOID:2377 multiple sclerosis 97 0.4381976
## DOID:2921 DOID:2921 glomerulonephritis 157 0.3962205
## DOID:2914 DOID:2914 immune system disease 415 0.3146773
## NES pvalue p.adjust qvalue rank
## DOID:10952 1.813389 9.231710e-06 0.004011178 0.003459462 1461
## DOID:0050117 1.631855 6.401359e-06 0.004011178 0.003459462 1759
## DOID:3213 1.862805 4.625461e-05 0.007472822 0.006444975 1334
## DOID:2377 1.855558 5.159601e-05 0.007472822 0.006444975 1225
## DOID:2921 1.818203 3.662543e-05 0.007472822 0.006444975 1461
## DOID:2914 1.587866 2.789069e-05 0.007472822 0.006444975 1762
## leading_edge
## DOID:10952 tags=36%, list=22%, signal=29%
## DOID:0050117 tags=36%, list=26%, signal=28%
## DOID:3213 tags=39%, list=20%, signal=31%
## DOID:2377 tags=38%, list=18%, signal=32%
## DOID:2921 tags=37%, list=22%, signal=30%
## DOID:2914 tags=34%, list=26%, signal=27%
## core_enrichment
## DOID:10952 355/4653/6775/7225/1436/3552/3684/3565/1017/1113/7124/3164/4524/89/3818/19/8654/729/4321/2213/4056/2153/186/348/88/5076/3315/6469/6362/3683/2185/2702/2212/4311/623/1285/119/26762/841/5551/7096/6354/6696/6356/5133/3553/931/3119/4043/6364/4868/345/2204/3458/285/894/6635/7454/4318/7436/6401/55806/7450
## DOID:0050117 581/6778/355/6775/3439/174/259197/3565/6556/6608/7124/920/4524/8685/213/9021/3663/729230/43/6372/2919/2213/713/3481/4481/887/10576/3568/50846/6441/4916/6440/2920/2529/2527/348/5175/5176/23683/335/10544/1440/4282/6469/10850/3456/6362/8651/10333/3002/6573/4317/3560/2833/230/6285/2212/5294/28/5551/7096/6354/3570/3700/6696/6356/2512/5133/5743/3566/3553/26191/3592/3115/7066/6601/5587/3119/5478/1535/6364/4158/345/9437/3458/285/6605/3240/3558/2688/3113/3043/9488/894/5972/3554/5141/4318/1380/3603/3574/3162/3600/6401/3953/7056/1230/6915/916/6772/3122/4504/5443/6402/5345/6439/12/1088/9173/5265/2995/671/6387/4780/7412/467/58528/3455/9402/4283/6773/7035/3562
## DOID:3213 355/3565/8744/9563/6357/6556/7124/3663/729230/43/337/4099/4321/344/3481/1464/1520/335/6469/3456/6285/2212/26762/5551/6354/6696/5133/9047/5743/3566/3553/5428/26191/3115/3119/2918/3458/1270/4720/953/4318
## DOID:2377 355/3565/8744/9563/6357/6556/7124/3663/43/337/4099/4321/344/3481/1464/1520/335/6469/3456/6285/2212/26762/5551/6354/6696/5133/9047/3566/3553/5428/26191/3115/3119/2918/3458/1270/4720
## DOID:2921 355/4653/6775/7225/1436/3552/3684/1017/1113/7124/3164/4524/89/3818/19/8654/729/4321/2213/4056/2153/186/348/88/5076/3315/6469/6362/2185/2702/2212/4311/623/1285/119/26762/5551/7096/6354/6696/5133/3553/931/3119/4043/6364/4868/345/2204/3458/285/6635/7454/4318/7436/6401/55806/7450
## DOID:2914 1026/581/355/6775/2100/596/1436/3552/3060/3565/653361/1215/3718/6556/8456/7124/920/8676/7432/4524/27040/3818/213/10095/547/3663/729230/43/10625/337/8174/729/1588/7293/7299/4321/2099/2213/5336/6441/348/5175/1794/335/29851/2705/1440/4282/9094/4593/640/64135/1843/2185/6573/6375/3560/2833/230/6285/2212/5521/5294/841/735/639/28/4689/6097/5551/3570/5993/5133/5743/231/3566/8034/3553/26191/7128/931/3115/23385/3119/3551/1535/8625/6846/843/1672/9437/2204/7535/3458/5580/285/4688/3240/3558/2688/2321/3146/8678/10875/3329/974/9508/2078/491/4318/1380/6363/3574/731/3162/9138/3600/7056/326/3702/4345/10519/916/6772/3122/5443/6402/1773/10621/4855/975/6387/3726/10235/2691/7412/3455/4283/6773/7035/10125/3562/3125MSigDB enrichment
There is no built-in function specific for MSigDB gene sets, but there is a universal function GSEA() which accepts manually-specified gene sets. The gene sets object is simply a two-column data frame:
- the first column is the gene set ID
- the second column is the gene ID
library(msigdbr)
gene_sets = msigdbr(category = "H")
map = gene_sets[, c("gs_name", "entrez_gene")]
map$entrez_gene = as.character(map$entrez_gene)

tb = GSEA(geneList = gene_diff_score, TERM2GENE = map)
## using 'fgsea' for GSEA analysis, please cite Korotkevich et al (2019).## preparing geneSet collections...## GSEA analysis...## leading edge analysis...## done...head(tb)## ID
## HALLMARK_G2M_CHECKPOINT HALLMARK_G2M_CHECKPOINT
## HALLMARK_MITOTIC_SPINDLE HALLMARK_MITOTIC_SPINDLE
## HALLMARK_E2F_TARGETS HALLMARK_E2F_TARGETS
## HALLMARK_ALLOGRAFT_REJECTION HALLMARK_ALLOGRAFT_REJECTION
## HALLMARK_UV_RESPONSE_DN HALLMARK_UV_RESPONSE_DN
## HALLMARK_PROTEIN_SECRETION HALLMARK_PROTEIN_SECRETION
## Description setSize
## HALLMARK_G2M_CHECKPOINT HALLMARK_G2M_CHECKPOINT 141
## HALLMARK_MITOTIC_SPINDLE HALLMARK_MITOTIC_SPINDLE 116
## HALLMARK_E2F_TARGETS HALLMARK_E2F_TARGETS 129
## HALLMARK_ALLOGRAFT_REJECTION HALLMARK_ALLOGRAFT_REJECTION 168
## HALLMARK_UV_RESPONSE_DN HALLMARK_UV_RESPONSE_DN 122
## HALLMARK_PROTEIN_SECRETION HALLMARK_PROTEIN_SECRETION 80
## enrichmentScore NES pvalue
## HALLMARK_G2M_CHECKPOINT -0.4118049 -2.085245 2.737659e-08
## HALLMARK_MITOTIC_SPINDLE -0.3664304 -1.818286 4.460484e-05
## HALLMARK_E2F_TARGETS -0.3556870 -1.780696 3.632204e-05
## HALLMARK_ALLOGRAFT_REJECTION 0.3850893 1.767234 3.673212e-05
## HALLMARK_UV_RESPONSE_DN -0.3539525 -1.767165 6.140368e-05
## HALLMARK_PROTEIN_SECRETION -0.3611194 -1.690229 9.935119e-04
## p.adjust qvalue rank
## HALLMARK_G2M_CHECKPOINT 1.368829e-06 1.095063e-06 1751
## HALLMARK_MITOTIC_SPINDLE 5.575605e-04 4.460484e-04 1717
## HALLMARK_E2F_TARGETS 5.575605e-04 4.460484e-04 1740
## HALLMARK_ALLOGRAFT_REJECTION 5.575605e-04 4.460484e-04 1530
## HALLMARK_UV_RESPONSE_DN 6.140368e-04 4.912294e-04 1557
## HALLMARK_PROTEIN_SECRETION 8.279266e-03 6.623413e-03 1369
## leading_edge
## HALLMARK_G2M_CHECKPOINT tags=46%, list=26%, signal=35%
## HALLMARK_MITOTIC_SPINDLE tags=42%, list=26%, signal=32%
## HALLMARK_E2F_TARGETS tags=40%, list=26%, signal=30%
## HALLMARK_ALLOGRAFT_REJECTION tags=38%, list=23%, signal=30%
## HALLMARK_UV_RESPONSE_DN tags=38%, list=23%, signal=29%
## HALLMARK_PROTEIN_SECRETION tags=32%, list=20%, signal=26%
## core_enrichment
## HALLMARK_G2M_CHECKPOINT 2176/4171/4678/991/5347/6558/7040/4926/8317/2130/4288/7514/3925/4691/9184/7027/1063/6541/1058/22974/4853/11104/1164/8451/1033/3151/890/1736/3609/699/9493/5887/10951/1432/10733/994/7153/3364/3161/332/4085/4212/9232/990/5933/546/1031/3837/6599/8065/996/4082/2935/3799/23649/7272/8819/6118/1756/11065/1111/4751/11004/1810/7290
## HALLMARK_MITOTIC_SPINDLE 6709/998/5347/2316/9771/2317/4926/23095/8476/10006/6654/1063/382/23637/23647/22974/4853/11104/4627/394/9344/7414/10928/613/699/9493/7153/5981/1739/10844/81/6093/22919/332/2017/10435/11135/7531/8936/996/667/4082/3799/7272/10013/4751/11004/832/9371
## HALLMARK_E2F_TARGETS 4171/4678/991/5347/6119/10714/7884/4288/7514/3925/701/10527/7037/1164/1033/10635/7283/3609/5395/5631/23468/10733/1786/994/5982/7153/5981/7913/6749/3364/3161/332/4085/9232/9833/203068/5902/6117/10606/7398/1031/2935/7465/23649/9319/9183/6118/1111/1029/5511/11004/5810
## HALLMARK_ALLOGRAFT_REJECTION 355/6775/9466/3565/6223/6357/7124/920/3109/729230/43/8477/2213/3662/10563/1520/3111/3683/8651/4050/10333/3002/3560/2833/914/4689/5551/7096/6354/6356/3848/10225/3566/3553/3001/3059/3592/9450/3551/822/9437/7535/3458/7163/3558/894/4830/2268/8767/7454/4318/3603/3717/6363/3574/3600/896/3108/3702/1230/924/916/6772/3122
## HALLMARK_UV_RESPONSE_DN 657/2869/8476/4325/140609/50937/7049/9112/3397/6541/4853/5376/5999/23576/4092/1432/4131/8405/120/273/857/1739/4781/1859/25836/11099/302/4052/546/3488/2064/5737/1301/29970/51460/5468/323/594/2202/2650/8871/23469/9975/136/2152/5195
## HALLMARK_PROTEIN_SECRETION 9367/9871/10059/5594/6197/23673/5868/1956/538/1182/8774/8027/9525/664/372/11079/26286/27236/8773/9805/7251/667/9183/3920/9341/3998Example for other organism
- GO enrichment
gseGO() accepts an OrgDb object as the source of the GO gene sets. We take pig as an example.
library(org.Ss.eg.db)## all_genes = keys(org.Ss.eg.db, keytype = "ENTREZID")
scores = sort(rnorm(length(all_genes)), decreasing = TRUE)
names(scores) = sample(all_genes)## ID Description
## GO:0032273 GO:0032273 positive regulation of protein polymerization
## GO:0070050 GO:0070050 neuron cellular homeostasis
## GO:0046785 GO:0046785 microtubule polymerization
## GO:0051147 GO:0051147 regulation of muscle cell differentiation
## GO:0006513 GO:0006513 protein monoubiquitination
## GO:0051149 GO:0051149 positive regulation of muscle cell differentiation
## setSize enrichmentScore NES pvalue p.adjust qvalue
## GO:0032273 28 -0.5996141 -2.057743 0.0001771071 0.4800458 0.4800458
## GO:0070050 19 -0.6431362 -1.960406 0.0005712951 0.4800458 0.4800458
## GO:0046785 18 -0.6481596 -1.953038 0.0005757671 0.4800458 0.4800458
## GO:0051147 41 -0.5149808 -1.923575 0.0003737260 0.4800458 0.4800458
## GO:0006513 13 -0.6916364 -1.913039 0.0011147938 0.6974265 0.6974265
## GO:0051149 18 -0.6201422 -1.868616 0.0016954538 0.6974265 0.6974265
## rank leading_edge
## GO:0032273 12468 tags=61%, list=27%, signal=44%
## GO:0070050 10538 tags=63%, list=23%, signal=49%
## GO:0046785 8688 tags=56%, list=19%, signal=45%
## GO:0051147 11334 tags=49%, list=25%, signal=37%
## GO:0006513 8245 tags=62%, list=18%, signal=50%
## GO:0051149 10234 tags=61%, list=23%, signal=47%
## core_enrichment
## GO:0032273 100192439/100521443/100157771/100517117/100738372/100522011/100519161/100525195/100192436/397584/100519405/100513778/100144410/396648/100521665/100625848/100127359
## GO:0070050 396875/100153645/780411/100154798/397663/100515870/100156112/100520160/106504095/100518811/100154273/768111
## GO:0046785 100524544/100511592/100519161/397584/100521289/100144410/396648/100521665/100625848/100511852
## GO:0051147 396762/100521411/733590/100517340/751859/100125973/100521659/100153269/100620481/100134969/407604/100620969/497618/100628206/397005/100127483/100157112/100737405/100127359/100125959
## GO:0006513 100517442/100525658/100517306/733673/100157336/100125968/100217383/100152963
## GO:0051149 733590/751859/100521659/100153269/407604/497618/100628206/397005/100737405/100127359/100125959- KEGG enrichment
The KEGG code of a specific organism can be found at https://rest.kegg.jp/list/organism
##                ID                      Description setSize enrichmentScore
## ssc04966 ssc04966   Collecting duct acid secretion      25      -0.5770542
## ssc05310 ssc05310                           Asthma      30      -0.4932128
## ssc04981 ssc04981  Folate transport and metabolism      29       0.4932072
## ssc00531 ssc00531    Glycosaminoglycan degradation      18       0.5017978
## ssc04977 ssc04977 Vitamin digestion and absorption      27      -0.4541064
## ssc00670 ssc00670        One carbon pool by folate      36       0.4084666
##                NES      pvalue  p.adjust    qvalue  rank
## ssc04966 -1.909719 0.000530514 0.1809053 0.1809053  6844
## ssc05310 -1.714840 0.006710325 0.9996389 0.9996389 12193
## ssc04981  1.707596 0.008988839 0.9996389 0.9996389 12786
## ssc00531  1.526959 0.050928608 0.9996389 0.9996389  8417
## ssc04977 -1.526148 0.028677233 0.9996389 0.9996389  3473
## ssc00670  1.479054 0.040490040 0.9996389 0.9996389 13676
##                            leading_edge
## ssc04966 tags=40%, list=15%, signal=34%
## ssc05310 tags=50%, list=27%, signal=37%
## ssc04981 tags=52%, list=28%, signal=37%
## ssc00531 tags=50%, list=19%, signal=41%
## ssc04977  tags=26%, list=8%, signal=24%
## ssc00670 tags=53%, list=30%, signal=37%
##                                                                                                                                                                            core_enrichment
## ssc04966                                                                                  100512277/397131/100523018/100518959/100156112/106504095/100518811/100521769/110257347/100523368
## ssc05310                                            100038010/100153387/396721/110257615/100135050/397106/396781/445528/100135040/110255290/100144594/100037921/100152827/106504372/397406
## ssc04981                                               396784/100626911/102167410/100525912/397677/100152536/397223/100627209/397180/110255210/100620829/100523776/397300/397579/102160472
## ssc00531                                                                                               100737146/100623722/404698/102158016/100624593/110262029/100517562/100271932/404697
## ssc04977                                                                                                                397681/100157809/100522014/100152503/100519306/100628018/100514273
## ssc00670 100622210/497050/100151976/100626911/100525563/102167410/100525912/100156922/100620652/100155425/100627209/397180/100170854/100523776/106504110/397300/110261260/396679/100514931- MSigDB
Use msigdbr::msigdbr_species() to see which organisms are supported.
gene_sets = msigdbr(species = "pig", category = "H")
map = gene_sets[, c("gs_name", "entrez_gene")]
map$entrez_gene = as.character(map$entrez_gene)

tb = GSEA(geneList = scores, TERM2GENE = map, pvalueCutoff = 1)
## using 'fgsea' for GSEA analysis, please cite Korotkevich et al (2019).## preparing geneSet collections...## GSEA analysis...## leading edge analysis...## done...head(tb)## ID
## HALLMARK_NOTCH_SIGNALING HALLMARK_NOTCH_SIGNALING
## HALLMARK_REACTIVE_OXYGEN_SPECIES_PATHWAY HALLMARK_REACTIVE_OXYGEN_SPECIES_PATHWAY
## HALLMARK_UNFOLDED_PROTEIN_RESPONSE HALLMARK_UNFOLDED_PROTEIN_RESPONSE
## HALLMARK_ESTROGEN_RESPONSE_LATE HALLMARK_ESTROGEN_RESPONSE_LATE
## HALLMARK_APOPTOSIS HALLMARK_APOPTOSIS
## HALLMARK_PI3K_AKT_MTOR_SIGNALING HALLMARK_PI3K_AKT_MTOR_SIGNALING
## Description
## HALLMARK_NOTCH_SIGNALING HALLMARK_NOTCH_SIGNALING
## HALLMARK_REACTIVE_OXYGEN_SPECIES_PATHWAY HALLMARK_REACTIVE_OXYGEN_SPECIES_PATHWAY
## HALLMARK_UNFOLDED_PROTEIN_RESPONSE HALLMARK_UNFOLDED_PROTEIN_RESPONSE
## HALLMARK_ESTROGEN_RESPONSE_LATE HALLMARK_ESTROGEN_RESPONSE_LATE
## HALLMARK_APOPTOSIS HALLMARK_APOPTOSIS
## HALLMARK_PI3K_AKT_MTOR_SIGNALING HALLMARK_PI3K_AKT_MTOR_SIGNALING
## setSize enrichmentScore NES
## HALLMARK_NOTCH_SIGNALING 32 0.4381367 1.545159
## HALLMARK_REACTIVE_OXYGEN_SPECIES_PATHWAY 48 0.3828598 1.491699
## HALLMARK_UNFOLDED_PROTEIN_RESPONSE 112 -0.3006924 -1.390912
## HALLMARK_ESTROGEN_RESPONSE_LATE 192 0.2651534 1.320690
## HALLMARK_APOPTOSIS 160 -0.2700092 -1.320393
## HALLMARK_PI3K_AKT_MTOR_SIGNALING 103 0.2875694 1.295059
## pvalue p.adjust qvalue rank
## HALLMARK_NOTCH_SIGNALING 0.02226649 0.3068472 0.2906973 5426
## HALLMARK_REACTIVE_OXYGEN_SPECIES_PATHWAY 0.02025937 0.3068472 0.2906973 4183
## HALLMARK_UNFOLDED_PROTEIN_RESPONSE 0.02244114 0.3068472 0.2906973 13733
## HALLMARK_ESTROGEN_RESPONSE_LATE 0.02947260 0.3068472 0.2906973 11496
## HALLMARK_APOPTOSIS 0.03068472 0.3068472 0.2906973 9389
## HALLMARK_PI3K_AKT_MTOR_SIGNALING 0.06048387 0.5040323 0.4775042 7021
## leading_edge
## HALLMARK_NOTCH_SIGNALING tags=25%, list=12%, signal=22%
## HALLMARK_REACTIVE_OXYGEN_SPECIES_PATHWAY tags=19%, list=9%, signal=17%
## HALLMARK_UNFOLDED_PROTEIN_RESPONSE tags=45%, list=30%, signal=31%
## HALLMARK_ESTROGEN_RESPONSE_LATE tags=33%, list=25%, signal=25%
## HALLMARK_APOPTOSIS tags=29%, list=21%, signal=23%
## HALLMARK_PI3K_AKT_MTOR_SIGNALING tags=23%, list=15%, signal=20%
## core_enrichment
## HALLMARK_NOTCH_SIGNALING 397297/100524215/780410/110259483/100513691/100620430/100516839/100153369
## HALLMARK_REACTIVE_OXYGEN_SPECIES_PATHWAY 100525560/100522018/100156736/100511107/100286873/100151836/100512476/100624335/396625
## HALLMARK_UNFOLDED_PROTEIN_RESPONSE 449528/100524723/407060/396600/100512107/110259542/100153354/100462758/100623102/100518582/100510978/100519695/100521132/100135675/100624328/100153550/397157/100737806/100153038/100216430/100523112/100144302/100521064/100381266/100511264/100514523/595132/100511875/397191/100101929/100151831/100511016/100155472/100521809/100192435/100038030/100158076/100312961/100521183/100156321/110257378/100523065/100154160/100525580/100153821/100523281/100622671/100518521/100519332/780440
## HALLMARK_ESTROGEN_RESPONSE_LATE 100037304/100627826/100157227/110255927/100156435/100514491/100516877/397067/110261029/100516442/494460/100156854/100513294/100737127/110259705/100626455/100518866/100514115/397638/100518064/100152612/100157578/100037294/414411/100739825/397688/100153899/100153200/100155053/100171389/100515166/654298/100524587/100515885/100513225/110261030/100415928/780401/100621518/100152339/100048957/396805/100625032/100515339/100158028/100738589/100622812/100627332/595114/100337672/100152749/100154898/100525320/654407/100522643/100520758/100158181/100520144/100156262/100154873/100523738/448855/733643/100171403
## HALLMARK_APOPTOSIS 397596/396709/780411/100152607/100037300/397057/396633/397648/100217390/100526005/100622590/100126286/100144442/397165/102168145/100049693/100156017/397663/397584/100518537/396826/100135665/100620969/100525045/100156492/396775/396917/100521609/100518913/100144503/396632/100154319/397109/100520925/100517533/100157112/100157641/100156777/100048932/397084/100510904/100157750/396913/396988/445512/100170126/100519138
## HALLMARK_PI3K_AKT_MTOR_SIGNALING 100152116/100153846/100271929/397504/100517503/445532/396659/397470/100519715/100513840/100240743/100523972/100144492/100154715/110259208/100519842/100519790/100512827/397156/100524587/100625946/100156099/100627936/100170851Examples for less well-studied organisms
When an OrgDb object is avaiable
Taking dolphin as an example. Since org_db is an OrgDb object, we can directly use gseGO():
library(AnnotationHub)## Loading required package: BiocFileCache## Loading required package: dbplyr##
## Attaching package: 'AnnotationHub'## The following object is masked from 'package:Biobase':
##
## cacheah = AnnotationHub()
org_db = ah[["AH118180"]]## loading from cacheall_genes = keys(org_db, keytype = "ENTREZID")
scores = sort(rnorm(length(all_genes)), decreasing = TRUE)
names(scores) = sample(all_genes)
tb = gseGO(geneList = scores, ont = "BP", OrgDb = org_db, pvalueCutoff = 1)## using 'fgsea' for GSEA analysis, please cite Korotkevich et al (2019).## preparing geneSet collections...## GSEA analysis...## leading edge analysis...## done...head(tb)## ID Description setSize
## GO:0006525 GO:0006525 arginine metabolic process 13
## GO:0010508 GO:0010508 positive regulation of autophagy 23
## GO:1901617 GO:1901617 organic hydroxy compound biosynthetic process 74
## GO:0046165 GO:0046165 alcohol biosynthetic process 50
## GO:0046173 GO:0046173 polyol biosynthetic process 28
## GO:0045165 GO:0045165 cell fate commitment 63
## enrichmentScore NES pvalue p.adjust qvalue rank
## GO:0006525 0.8002824 2.201641 6.313078e-06 0.01469053 0.01469053 3696
## GO:0010508 -0.6482291 -2.136676 5.526938e-05 0.06430593 0.06430593 1299
## GO:1901617 -0.4411394 -1.889270 8.867862e-05 0.06878505 0.06878505 5612
## GO:0046165 -0.4782397 -1.868743 2.941145e-04 0.17110114 0.17110114 5612
## GO:0046173 -0.5441482 -1.874031 1.160157e-03 0.49737091 0.49737091 8274
## GO:0045165 0.4223582 1.733316 1.282435e-03 0.49737091 0.49737091 5286
## leading_edge
## GO:0006525 tags=62%, list=13%, signal=54%
## GO:0010508 tags=26%, list=4%, signal=25%
## GO:1901617 tags=38%, list=19%, signal=31%
## GO:0046165 tags=42%, list=19%, signal=34%
## GO:0046173 tags=61%, list=29%, signal=43%
## GO:0045165 tags=37%, list=18%, signal=30%
## core_enrichment
## GO:0006525 101330533/101339624/101337763/101319666/101316168/101328272/101336349/101331088
## GO:0010508 101325065/101330530/101333388/117313758/101330316/101322539
## GO:1901617 101318969/101326269/101332074/101335271/101337731/101326674/109547063/101335557/101334172/101325919/101328932/101325222/101325410/101337692/117311059/101330340/117311100/101330844/101323205/101337369/101325670/101331125/101318683/101335522/109547053/101329463/101326383/101317725
## GO:0046165 101318969/101332074/101335271/101335557/101334172/101325919/101328932/101325222/101325410/117311059/101330340/117311100/101330844/101323205/101325670/101331125/101318683/101335522/109547053/101329463/101317725
## GO:0046173 101322754/101321718/101334872/101320892/101318969/101335557/101328932/101325222/101325410/117311059/101330340/101330844/101323205/101318683/101335522/101329463/101317725
## GO:0045165 101316620/101331847/101336244/101330163/101326426/101339678/101327291/101328401/117308247/101324486/101334267/101328936/101322959/101318912/101331189/101321384/117307508/101317354/101325866/101329184/101326957/101327467/101335924gseKEGG() also supports many other orgainsms
gseKEGG(geneList = scores, organism = ...)Manually construct the gene sets
We have introduced many ways to obtain gene sets for less well-studies organisms. The only thing to do here is to convert gene sets to a two-column data frame where gene sets are in the first column and genes are in the second column. Then use GSEA().
GSEA(geneList = scores, TERM2GENE = ...)Look at the tb object
We used the same variable name tb for the object returned by the various enrichment functions. They are all in the same format. It looks like a table, but be careful, it is actually not:
class(tb)## [1] "gseaResult"
## attr(,"package")
## [1] "DOSE"str(tb)## Formal class 'gseaResult' [package "DOSE"] with 13 slots
## ..@ result :'data.frame': 2327 obs. of 11 variables:
## .. ..$ ID : chr [1:2327] "GO:0006525" "GO:0010508" "GO:1901617" "GO:0046165" ...
## .. ..$ Description : chr [1:2327] "arginine metabolic process" "positive regulation of autophagy" "organic hydroxy compound biosynthetic process" "alcohol biosynthetic process" ...
## .. ..$ setSize : int [1:2327] 13 23 74 50 28 63 10 10 23 23 ...
## .. ..$ enrichmentScore: num [1:2327] 0.8 -0.648 -0.441 -0.478 -0.544 ...
## .. ..$ NES : num [1:2327] 2.2 -2.14 -1.89 -1.87 -1.87 ...
## .. ..$ pvalue : num [1:2327] 6.31e-06 5.53e-05 8.87e-05 2.94e-04 1.16e-03 ...
## .. ..$ p.adjust : num [1:2327] 0.0147 0.0643 0.0688 0.1711 0.4974 ...
## .. ..$ qvalue : num [1:2327] 0.0147 0.0643 0.0688 0.1711 0.4974 ...
## .. ..$ rank : num [1:2327] 3696 1299 5612 5612 8274 ...
## .. ..$ leading_edge : chr [1:2327] "tags=62%, list=13%, signal=54%" "tags=26%, list=4%, signal=25%" "tags=38%, list=19%, signal=31%" "tags=42%, list=19%, signal=34%" ...
## .. ..$ core_enrichment: chr [1:2327] "101330533/101339624/101337763/101319666/101316168/101328272/101336349/101331088" "101325065/101330530/101333388/117313758/101330316/101322539" "101318969/101326269/101332074/101335271/101337731/101326674/109547063/101335557/101334172/101325919/101328932/1"| __truncated__ "101318969/101332074/101335271/101335557/101334172/101325919/101328932/101325222/101325410/117311059/101330340/1"| __truncated__ ...
## ..@ organism : chr "Tursiops truncatus"
## ..@ setType : chr "BP"
## ..@ geneSets :List of 7236
## .. ..$ GO:0000002: chr [1:10] "101315666" "101325920" "101326047" "101328885" ...
## .. ..$ GO:0000012: chr [1:3] "101321216" "101324135" "101337120"
## .. ..$ GO:0000018: chr [1:19] "101318518" "101319565" "101320448" "101320591" ...
## .. ..$ GO:0000019: chr [1:2] "101321967" "101338373"
## .. ..$ GO:0000022: chr [1:2] "101315654" "101328106"
## .. ..$ GO:0000027: chr [1:33] "101315465" "101316856" "101319900" "101320222" ...
## .. ..$ GO:0000028: chr [1:34] "101317415" "101318043" "101318467" "101318567" ...
## .. ..$ GO:0000032: chr "101318382"
## .. ..$ GO:0000038: chr [1:24] "101318721" "101319800" "101320860" "101321283" ...
## .. ..$ GO:0000041: chr [1:87] "101315672" "101316332" "101316680" "101316885" ...
## .. ..$ GO:0000045: chr [1:44] "101316021" "101316129" "101317161" "101317562" ...
## .. ..$ GO:0000050: chr "101330533"
## .. ..$ GO:0000052: chr [1:4] "101319666" "101331088" "101336349" "117313824"
## .. ..$ GO:0000053: chr "101330533"
## .. ..$ GO:0000054: chr [1:17] "101318918" "101319915" "101322461" "101323043" ...
## .. ..$ GO:0000055: chr [1:9] "101323043" "101324936" "101332258" "101333049" ...
## .. ..$ GO:0000056: chr [1:8] "101319915" "101323043" "101334636" "101335049" ...
## .. ..$ GO:0000070: chr [1:69] "101315654" "101315716" "101316211" "101316537" ...
## .. ..$ GO:0000075: chr [1:63] "101316695" "101316733" "101318624" "101319304" ...
## .. ..$ GO:0000076: chr [1:13] "101316733" "101320717" "101320935" "101323238" ...
## .. ..$ GO:0000077: chr [1:31] "101316733" "101319304" "101320252" "101320465" ...
## .. ..$ GO:0000079: chr [1:38] "101316500" "101317117" "101319016" "101319831" ...
## .. ..$ GO:0000082: chr [1:30] "101317117" "101317432" "101319577" "101320635" ...
## .. ..$ GO:0000086: chr [1:34] "101316733" "101318219" "101318851" "101319304" ...
## .. ..$ GO:0000096: chr [1:19] "101317866" "101318072" "101318630" "101320181" ...
## .. ..$ GO:0000097: chr [1:14] "101318072" "101318630" "101320181" "101320414" ...
## .. ..$ GO:0000098: chr [1:2] "101317866" "101322308"
## .. ..$ GO:0000101: chr "101316505"
## .. ..$ GO:0000103: chr [1:2] "101333313" "101333364"
## .. ..$ GO:0000122: chr [1:289] "101315507" "101315608" "101315627" "101315712" ...
## .. ..$ GO:0000132: chr [1:8] "101318624" "101321627" "101323274" "101330417" ...
## .. ..$ GO:0000154: chr [1:30] "101315879" "101316217" "101318617" "101318650" ...
## .. ..$ GO:0000165: chr [1:150] "101315540" "101315821" "101315844" "101315877" ...
## .. ..$ GO:0000183: chr [1:2] "101320305" "101323967"
## .. ..$ GO:0000184: chr [1:17] "101317466" "101317816" "101318077" "101320986" ...
## .. ..$ GO:0000209: chr [1:107] "101315684" "101315840" "101316076" "101316166" ...
## .. ..$ GO:0000212: chr [1:3] "101325492" "101326056" "101326437"
## .. ..$ GO:0000226: chr [1:319] "101315473" "101315515" "101315532" "101315537" ...
## .. ..$ GO:0000244: chr [1:4] "101316501" "101317106" "101320772" "101322228"
## .. ..$ GO:0000245: chr [1:28] "101316036" "101316848" "101318225" "101318825" ...
## .. ..$ GO:0000255: chr "101338869"
## .. ..$ GO:0000266: chr [1:13] "101319716" "101319797" "101322141" "101322957" ...
## .. ..$ GO:0000270: chr [1:4] "101327680" "101328729" "101339109" "117309087"
## .. ..$ GO:0000271: chr [1:24] "101315985" "101316031" "101316992" "101321222" ...
## .. ..$ GO:0000272: chr [1:7] "101322619" "101330120" "101330457" "101331404" ...
## .. ..$ GO:0000278: chr [1:306] "101315654" "101315716" "101315741" "101315815" ...
## .. ..$ GO:0000280: chr [1:154] "101315650" "101315654" "101315716" "101316211" ...
## .. ..$ GO:0000281: chr [1:23] "101316479" "101317224" "101317286" "101317408" ...
## .. ..$ GO:0000288: chr [1:24] "101315620" "101315678" "101317451" "101317568" ...
## .. ..$ GO:0000289: chr [1:14] "101315678" "101317451" "101317568" "101318606" ...
## .. ..$ GO:0000290: chr [1:7] "101327550" "101327755" "101329036" "101331769" ...
## .. ..$ GO:0000294: chr [1:2] "101325668" "101333594"
## .. ..$ GO:0000301: chr "101336186"
## .. ..$ GO:0000302: chr [1:16] "101319210" "101319583" "101322539" "101323139" ...
## .. ..$ GO:0000303: chr [1:7] "101323814" "101325225" "101332604" "101337010" ...
## .. ..$ GO:0000305: chr [1:7] "101323814" "101325225" "101332604" "101337010" ...
## .. ..$ GO:0000338: chr [1:4] "101320449" "101328620" "101334252" "101337481"
## .. ..$ GO:0000349: chr "101326572"
## .. ..$ GO:0000350: chr [1:2] "101332951" "101334786"
## .. ..$ GO:0000375: chr [1:230] "101315583" "101315667" "101315762" "101315834" ...
## .. ..$ GO:0000377: chr [1:230] "101315583" "101315667" "101315762" "101315834" ...
## .. ..$ GO:0000379: chr [1:3] "101317193" "101327326" "101339487"
## .. ..$ GO:0000380: chr [1:45] "101315762" "101316036" "101317431" "101317847" ...
## .. ..$ GO:0000381: chr [1:34] "101315762" "101317847" "101319370" "101320027" ...
## .. ..$ GO:0000387: chr [1:32] "101315917" "101316501" "101316931" "101317106" ...
## .. ..$ GO:0000389: chr "101334786"
## .. ..$ GO:0000390: chr [1:3] "101315583" "101338935" "109550010"
## .. ..$ GO:0000393: chr [1:3] "101326572" "101332951" "101334786"
## .. ..$ GO:0000394: chr [1:9] "101317193" "101319579" "101327326" "101332247" ...
## .. ..$ GO:0000395: chr [1:3] "101327231" "101336797" "101339966"
## .. ..$ GO:0000398: chr [1:230] "101315583" "101315667" "101315762" "101315834" ...
## .. ..$ GO:0000413: chr [1:29] "101316348" "101317534" "101318791" "101321235" ...
## .. ..$ GO:0000422: chr [1:33] "101316021" "101317608" "101317975" "101318574" ...
## .. ..$ GO:0000423: chr [1:4] "101317608" "101318574" "101328761" "101339128"
## .. ..$ GO:0000447: chr [1:9] "101318699" "101319173" "101320141" "101322154" ...
## .. ..$ GO:0000448: chr "101320916"
## .. ..$ GO:0000454: chr [1:2] "101316217" "117307807"
## .. ..$ GO:0000460: chr [1:32] "101318334" "101318462" "101318699" "101319173" ...
## .. ..$ GO:0000461: chr [1:4] "101319173" "101320141" "101322759" "117310230"
## .. ..$ GO:0000462: chr [1:33] "101316911" "101317350" "101317639" "101318699" ...
## .. ..$ GO:0000463: chr [1:17] "101315781" "101320270" "101320916" "101321745" ...
## .. ..$ GO:0000466: chr [1:23] "101318334" "101318699" "101319173" "101320141" ...
## .. ..$ GO:0000467: chr [1:9] "101318334" "101320352" "101320475" "101320636" ...
## .. ..$ GO:0000470: chr [1:24] "101315781" "101318617" "101320270" "101320916" ...
## .. ..$ GO:0000472: chr [1:3] "101318699" "101326131" "101338419"
## .. ..$ GO:0000479: chr [1:14] "101317639" "101318699" "101319173" "101320141" ...
## .. ..$ GO:0000480: chr [1:3] "101318699" "101326131" "101338419"
## .. ..$ GO:0000481: chr "117313214"
## .. ..$ GO:0000491: chr [1:14] "101320200" "101320774" "101321311" "101323180" ...
## .. ..$ GO:0000492: chr [1:12] "101320774" "101321311" "101323180" "101324753" ...
## .. ..$ GO:0000493: chr [1:2] "101320200" "101332019"
## .. ..$ GO:0000494: chr [1:3] "101320515" "101322450" "109549229"
## .. ..$ GO:0000495: chr "109550334"
## .. ..$ GO:0000578: chr [1:2] "101324185" "101324489"
## .. ..$ GO:0000706: chr [1:3] "101317576" "101320081" "101333500"
## .. ..$ GO:0000707: chr "101338843"
## .. ..$ GO:0000708: chr "101325000"
## .. ..$ GO:0000709: chr "101325000"
## .. ..$ GO:0000710: chr "117308960"
## .. .. [list output truncated]
## ..@ geneList : Named num [1:28931] 4.05 3.99 3.83 3.77 3.73 ...
## .. ..- attr(*, "names")= chr [1:28931] "101330533" "117311982" "101329559" "101328169" ...
## ..@ keytype : chr "ENTREZID"
## ..@ permScores : num[0 , 0 ]
## ..@ params :List of 6
## .. ..$ pvalueCutoff : num 1
## .. ..$ eps : num 1e-10
## .. ..$ pAdjustMethod: chr "BH"
## .. ..$ exponent : num 1
## .. ..$ minGSSize : num 10
## .. ..$ maxGSSize : num 500
## ..@ gene2Symbol: chr(0)
## ..@ readable : logi FALSE
## ..@ termsim : num[0 , 0 ]
## ..@ method : chr(0)
## ..@ dr : list()In the ORA analysis by clusterProfiler, we mentioned using
tb@resultreturns the full enrichment table. But this is not the case for the GSEA anlaysis!. In GSEA anlaysis by clusterProfiler,tb@resultstill returns the significant terms. AddpvalueCutoff = 1argument if you need the full table.
Practice
Practice 1
The input for e.g. gseGO() is a vector of gene-level scores, thus what metric is used for measuring gene-level differentiation has impact on the GSEA analysis. Here you use the following four gene-level metrics, apply them with gseGO() (GO BP + human) and compare the GSEA results.
Here we use the p53_expr.rds dataset.
lt = readRDS(system.file("extdata", "p53_expr.rds", package = "GSEAtraining"))
expr = lt$expr
condition = lt$condition
First convert gene IDs to EntreZ IDs for expr:
mat = convert_to_entrez_id(expr)## gene id might be SYMBOL (p = 0.610 )## 'select()' returned 1:many mapping between keys and columnsThen calculate the column indicies of WT and MUT
The four gene-level metrics:
- signal-to-noise ratio
- t-value
- log2 fold change
- signed log10 p-values
They can be calculated as:
s2n = apply(mat, 1, function(x) {
    x1 = x[ind_MUT]
    x2 = x[ind_WT]

    (mean(x1) - mean(x2))/(sd(x1) + sd(x2))
})

tvalue = apply(mat, 1, function(x) {
    x1 = x[ind_MUT]
    x2 = x[ind_WT]

    t.test(x1, x2)$statistic
})

log2fc = apply(mat, 1, function(x) {
    x1 = x[ind_MUT]
    x2 = x[ind_WT]

    log2(mean(x1)/mean(x2))
})

logp = apply(mat, 1, function(x) {
    x1 = x[ind_MUT]
    x2 = x[ind_WT]

    t = t.test(x1, x2)
    sign(t$statistic)*(-log10(t$p.value))
})
Now use these four numeric vectors to perform GSEA analysis (on GO BP gene sets).
Solution
First to sort all the numeric vectors:
s2n = sort(s2n, decreasing = TRUE)
tvalue = sort(tvalue, decreasing = TRUE)
log2fc = sort(log2fc, decreasing = TRUE)
logp = sort(logp, decreasing = TRUE)
tb1 = gseGO(geneList = s2n, ont = "BP", OrgDb = org.Hs.eg.db)## using 'fgsea' for GSEA analysis, please cite Korotkevich et al (2019).## preparing geneSet collections...## GSEA analysis...## leading edge analysis...## done...tb2 = gseGO(geneList = tvalue, ont = "BP", OrgDb = org.Hs.eg.db)## using 'fgsea' for GSEA analysis, please cite Korotkevich et al (2019).## preparing geneSet collections...## GSEA analysis...## leading edge analysis...## done...tb3 = gseGO(geneList = log2fc, ont = "BP", OrgDb = org.Hs.eg.db)## using 'fgsea' for GSEA analysis, please cite Korotkevich et al (2019).## preparing geneSet collections...## GSEA analysis...## leading edge analysis...## done...tb4 = gseGO(geneList = logp, ont = "BP", OrgDb = org.Hs.eg.db)## using 'fgsea' for GSEA analysis, please cite Korotkevich et al (2019).## preparing geneSet collections...## GSEA analysis...## leading edge analysis...## done...Get the “real data frames” for all terms.
tb1 = tb1@result
tb2 = tb2@result
tb3 = tb3@result
tb4 = tb4@resultlibrary(eulerr)
plot(euler(list("s2n" = tb1$ID[tb1$p.adjust < 0.05],
"tvalue" = tb2$ID[tb2$p.adjust < 0.05],
"log2fc" = tb3$ID[tb3$p.adjust < 0.05],
"logp" = tb4$ID[tb4$p.adjust < 0.05])),
quantities = TRUE)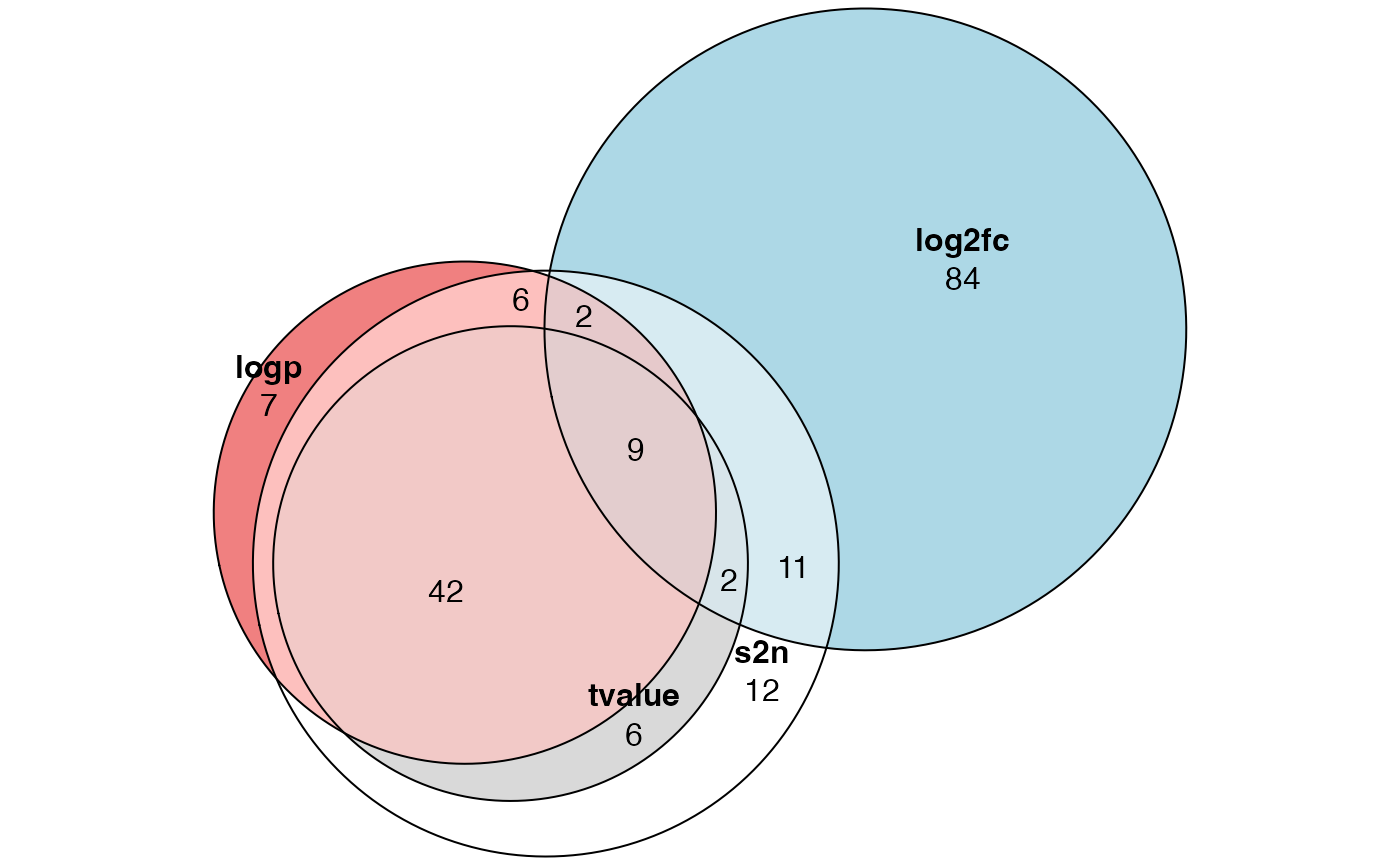

Conclusion: do not use log2 fold change for GSEA analysis, and using signal-to-noise or t-value (or other similar statistics) is always a good choice.